Grafana
The MONIT Grafana service is available at: https://monit-grafana.cern.ch. You should login with SSO (the user/password login does not work). The official Grafana documentation can be found here.
Organizations
Grafana is managed around the concept of organizations, grouping related data sources, users, and dashboards together.
WELCOME is the default organization, and you will be redirected there the first time you access Grafana.
After that you will be sync to the public organizations, like MONIT with few core dashboards:
Other organizations created on-demand for projects or services: ATLAS, EOS, etc.
Organizations Access Levels
MONIT provides different Access Levels used to grant users with Viewer rights to the organizations. The list below describes the different levels and supported integration:
Public: All Grafana users are granted access to the organization dashboards by default.Private: Users are not granted access to the organization automatically. Users can be added only manually or through Teams e-group synchronization.CERN Only: Only users with@cern.chSSO accounts are granted access. It is still possible adding other users manually or through Teams e-group synchronization. Strict policy of removing any manually added non-CERN user can be requested if required.E-Group: Only users available in Teams linked to an e-group will be automatically added to the organization. Users will be also removed from the organization once not members of the team anymore.
NOTE: Only users who have logged in to MONIT Grafana in the past 24 months are considered active. Any user not seen for longer is revoked access and removed from the organizations until new login is performed.
User and Roles
All users that try to access Grafana (once logged in via SSO) automatically become Grafana users. They are also automatically associated to all Public organizations.
For each organization, each user can have one of the following roles: Admin, Editor, Viewer. More details here.
Teams
Grafana Teams makes it easy to organize and administer groups of users in your Organization. Teams allows you to grant permissions to a group of users instead of granting permissions to individual users one at a time. Grafana docs
E-Group Integration
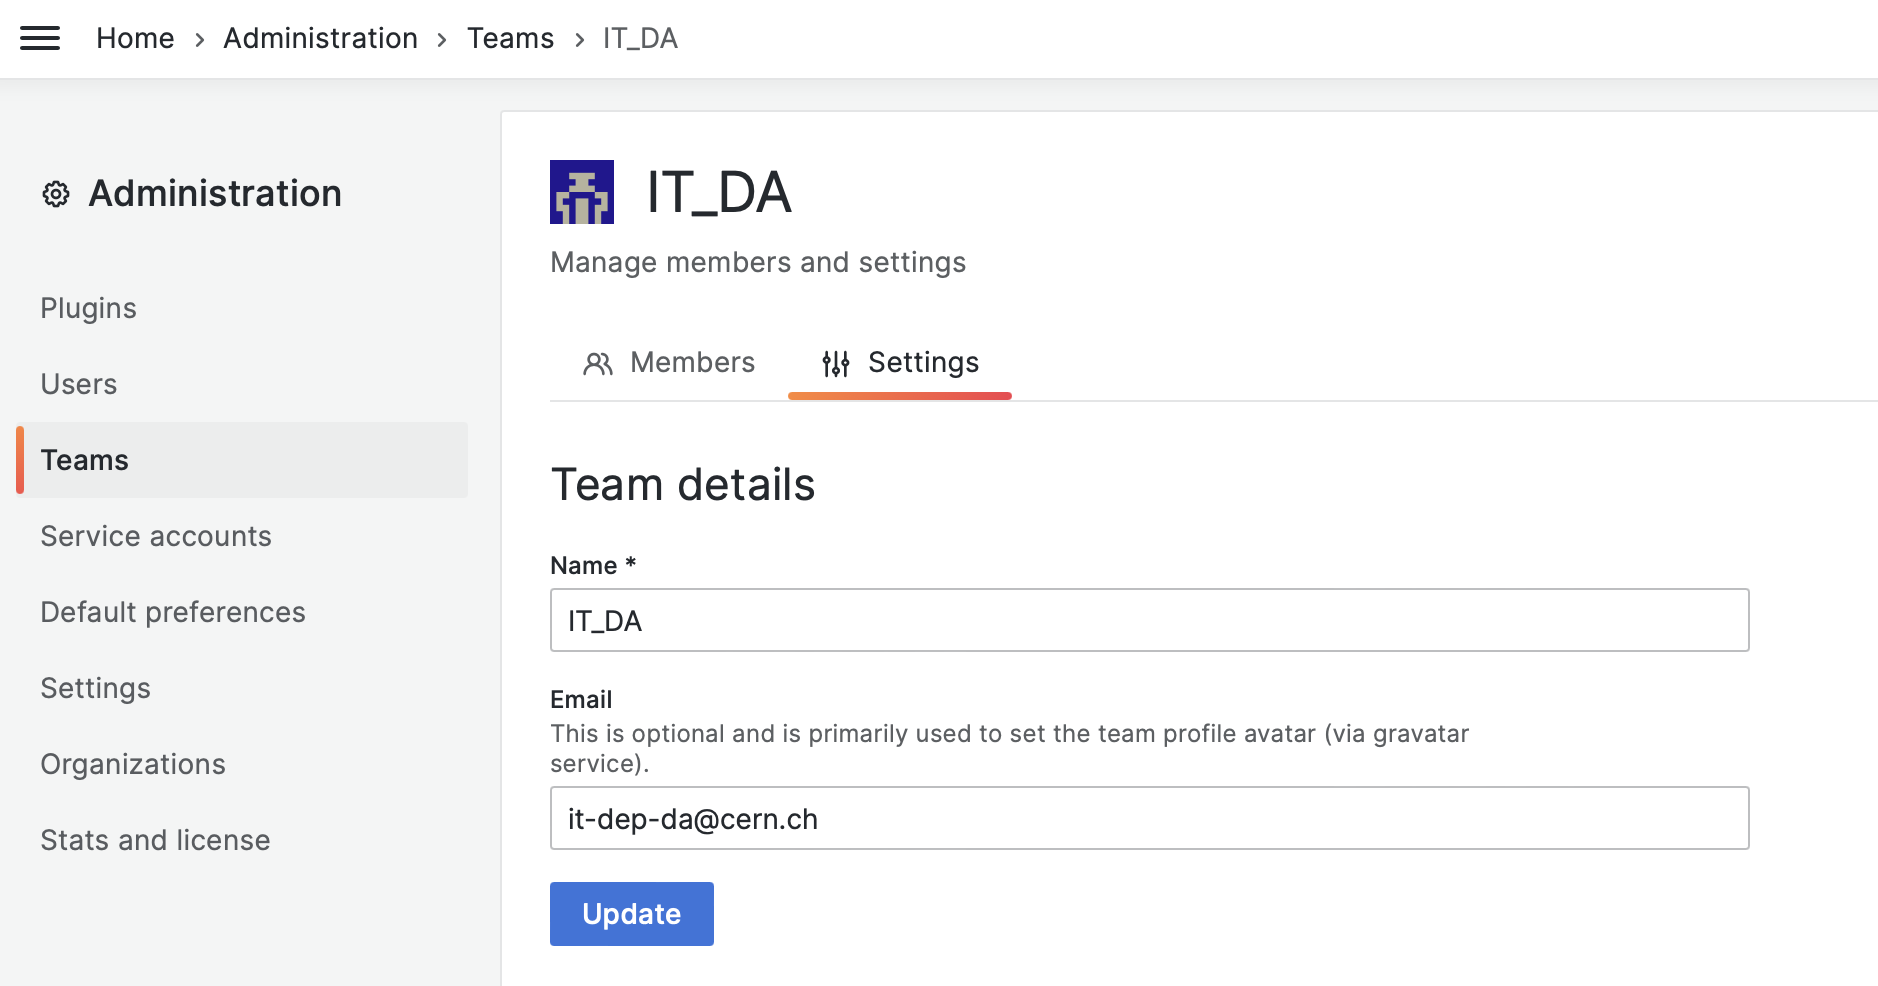
In order to facilitate adding members into the teams, MONIT integrated them with CERN e-groups that allows members synchronization. It is very easy to link your Grafana Team to a CERN e-group by just setting the Team email pointing to the e-group one (e.g. it-dep-da@cern.ch), as depicted below. Once Grafana Team is linked to an e-group, all the active MONIT Grafana users who are also members of that e-group will be added into the team and the corresponding organization, if not already there. The process is continuous and any update of e-group membership will take effect in Grafana with the next execution of the synchronization job (within 30 minutes).
NOTE:
- Once team is linked to an e-group, the latter becomes the source of members, and any user added manually to the team will be removed if not in the corresponding e-group. Users will not be removed from the organization if not team members anymore. This could be enforced by switching the organization to the
E-GroupAccess Level as described above. - This feature is intended to be used for small and medium-sized teams. Please note that there is currently limit of using e-groups with more than 1000 members.
Datasources
As part of the integration with MONIT you should also get a readonly account credentials, so you can configure datasources on your side. Supported Datasources from MONIT are "Elasticsearch" (for opensearch access), InfluxDB (for InfluxDB access) and Prometheus (for accessing Mimir) since these are the backends we currently provide (this doesn't mean you can't use other datasources from Grafana).
Elasticsearch datasource
- URL: https://\<cluster>.cern.ch:443/es
- Valid clusters are: monit-timber (public logs), monit-timberprivate (private logs), monit-opensearch (shor-term metrics), monit-opensearch-lt (long-term metrics)
- Basic auth: enabled
- User: \<producer>_ro
- Password: Check the tbag service
- Index name: [monit_\
- Pattern: Daily (most of the cases)
- Time field name: metadata.timestamp (unless you need to plot by some other specific field)
- ES version: 7.10+
Important: Grafana will report that the datasource is not supported after version X, this should not create any issue when plotting data. Migration to the Opensearch datasource will be investigated and done once it's fully functional.
InfluxDB datasource
- URL: Depends on the data you want to access, so you will need to ask the MONIT team
- Basic auth: enabled
- User: \<producer>_ro
- Password: Check the tbag service
- Database: monit_production_\<producer>
- Time filtering show tag queries: 3h
Prometheus datasource
- URL: https://monit-prom-lts.cern.ch/prometheus/
- Basic auth: enabled
- User: \<producer>
- Password: Check the tbag service
- Manage alerts via Alerting UI: disabled
Grafana annotations
Grafana provides the possibility to use some datasources as annotations to add extra useful information in your plots. From the monitoring team, we aim to provide a set of central datasources that can be used for this, under this page we will be building a list of them and try to summarise which information is inside in order for service managers to use them.
Please note that in order to get the datasource added into your organisation, you need to request so opening a SNOW ticket against us first, so we can add it.
Grafana Proxy
JSON data can be retrieved with a HTTP GET request to Grafana specifying the desired query for a particular database.
curl -H "Authorization: Bearer GRAFANA_TOKEN" "https://monit-grafana.cern.ch/api/datasources/proxy/DATA_SOURCE_ID/query?db=DATABASE_NAMEr&q=QUERY"
- The query is organization specific so please avoid having the browser sessions for the same user running on different organizations while querying.
- The data source id can be retrieved from Grafana by inspecting the actual queries run by Grafana in the browser. You can also ask an organisation admin to provide it to you, it can be retrieved on the datasources page for the organisation.
- In case the request is done via CLI (e.g. curl, wget), hence without a valid session cookie, a Grafana API Token should be used for authentication. The token has to be created by the organization admin and specified as HTTP header of the request.
Query example for InfluxDB
curl -X POST -H "Authorization: Bearer TOKEN_HERE" "https://monit-grafana.cern.ch/api/datasources/proxy/7731/query?db=monit_production_cmsjm" --data-binary "@query_file"
q=select * from condor where time > now() - 1h limit 1
Query example for Elasticsearch/Opendistro/OpenSearch
curl -X POST -H 'Content-Type: application/json' -H "Authorization: Bearer TOKEN_HERE" "https://monit-grafana.cern.ch/api/datasources/proxy/7617/_msearch" --data-binary "@query_file"
{"search_type": "query_then_fetch","ignore_unavailable": true,"index": ["monit_prod_wmagent_*", "monit_prod_wmagent_*", "monit_prod_wmagent_*"]}
{"query" : {"match_all" : {}}, "from" : 0, "size" : 10}
Grafana Upgrades
Every once in a while the MONIT Grafana service is upgraded. As rule of thumb we stay away from fresh versions (e.g. 6.2.0) and upgrade when the first bugfix version is available (e.g. 6.2.1).
Nevertheless, this is susceptible to the service's status. For instance a security event may trigger a forceful upgrade.
Procedure
This information only refers to major upgrades (e.g. 6.7 to 6.8), minor upgrades (e.g. 6.7.2 to 6.7.3) are not included since they are always backward compatible.
The following procedure was developed so users can still benefit from their unofficial plugins and remain able to fix any incompatibility against the new Grafana version.
- Grafana upgrades are announced with at least 1-week notice;
- On the scheduled day the Grafana service is upgraded;
- A temporary Grafana (monit-grafana-old.cern.ch) is enabled running the previous release;
- The Grafana old endpoint is maintained for the period of 1 month;
- Users are expected to solve any conflicts with the main Grafana version during this period;
- Once the period is over the Grafana old endpoint is discontinued;
Plugins
All official plugins are maintained by the MONIT team. With every upgrade the team tests and assures all official plugins are working.
The MONIT team is however not responsible for the maintenance of unofficial plugins. If an unofficial plugin breaks with an upgrade, it's up to the team that requested the plugin to fix it.