Service SLIs/SLOs
This section provides an introduction to Service Level Indicators (SLIs) and Service Level Objectives (SLOs) and explains how to configure and manage your indicators and objectives in the MONIT infrastructure.
What are SLIs/SLOs
SLIs
SLIs are metrics which provide clear information about the level of service experienced by its users; in other words, they show what is working and what is not for the users. To achieve this, service managers should not consider performance or internal host metrics for SLIs, but rather something providing information on the actual throughput, readiness, latency, response, etc., depending on the nature of the monitored service. There might be different representations of SLI metrics; the one we find the most representative is percentage-based, as it provides a very clear view about the service level even to users that are not aware of its internal processes and operations.
SLOs
An SLO is a target value for an SLI, measured over a period of time. It represents the tolerated drop of the delivered service level over time. As any service requires intervention or other downtime periods in general, the SLO should never be set to 100%. Another important point for the SLO is that it should be set over a long time interval (at least one week or more); otherwise, short glitches or interventions would exhaust it completely (e.g. SLO: 99,9% tolerated downtimes Daily:1m 26s; Weekly:10m 4s; Monthly:43m 49s;)
Error Budget
SLOs are used for calculating the "Error Budget" of a service: the amount of time the service can fail to perform within a certain period and still meet the SLO. The Error Budget provides a clear view how many bad individual events are allowed to happen during the remainder of the SLO period without violating its threshold. It's a good indicator for whether teams should focus more efforts on service realiability or features development.
How are SLIs/SLOs calculated
SLIs
There are two main algorithms used by MONIT to calculate the final SLIs.
basic_sli
This configuration type is used for metrics that have been either already calculated as a percentage-based SLI or need to be evaluated based on a concrete threshold.
- the input metric is already an SLI - the value is propagated "as is" into the MONIT infrastructure; no threshold configuration is required in this case;
- the SLI is calculated based on a threshold - the value of the SLI for each 1-minute interval is considered 100% if the value is within the required range, or 0% if outside; different parameters should be provided in the configuration file by the service manager (
above_thresholdorbelow_thresholdrespectively) to specify if the metric should be considered in a correct state when above or below the threshold.
basic_sli:
      metric: core_utilisation
      below_threshold: 60
Notice
The metric name core_utilisation is a reference to a metric query configuration (more details below)
good_total_ratio
This SLI type is calcualted by dividing the "good" events by the "total" number of all events. It requires the service manager to provide one input metric representing the "good" events value and either another metric or a static value representing the totals.
      good_total_ratio:
            good_values: good_requests
            total_values: 250
Notice
The metric name good_requests is a reference to a metric query configuration (more details below)
SLOs
Since SLOs are just the objective threshold value, we actually calculate the "Error Budget" for a given SLI. It's computed as a moving average of the SLI metric over the time period configured with the slo_interval_days parameter, compared against the defined SLO threshold value (slo_threshold). Please note that the Error Budget value can be negative if the SLI downtime goes beyond the tolerated threshold.
How to configure SLIs/SLOs
The workflow is fully driven by configuration files providing the required SLI/SLO information. These files are managed by service managers and committed to a GitLab repository. A scheduled MONIT script utilises the configuration data in order to query the Grafana datasources and collect the requested metric values. It then propagates the results, enriched with other specific SLI, SLO configuration fields and custom labels, to a dedicate Influx DB instance. Pre-configured continues queries (CQs) take care of converting the raw data into appropriate SLI values and store the data long-term into the DB instance. Generic SLI dashboards in the MONIT organization are configured to dinamically plot the data and make it available by default.
As explained, all configurations are centrally managed in our monit-sli-configs
repository. It is required that you first create a branch for your changes as direct writes to the master branch are restricted for validation purposes. A sample document looks like this:
metrics:
    <metric name>:
        org_id:
        datasource:
        interval:
        offset_intervals:
        query: |
            <query>

sli:
    <sli name>:
        display_name:
        fe_name:
        labels:
          - <label>
        <sli type>:
            metric:
        slo_threshold:
        slo_interval_days:
Configurations are divided into two section:
metrics- contains the configuration about the raw metrics we scrape from Grafana;sli- contains the section about the SLI/SLO configuration.
Metric fields:
- <metric name> - the name for the metric used for reference within the
sliconfig section; - org_id - indicates the Grafana ID of the organization that contains the datasource field; it can be obtained in the following way:
- access Grafana in your browser and change to the desired organization;
- check the orgid value at the end of the URL.

- datasource - indicates the name of the Grafana datasource that's used to run the queries; currently three types of datasources are supported:
- InfluxDB - has two types of queries that can be extracted:
- With epoch timestamps, in this case the timestamps are going to be changed automatically by the GitLab CI using placeholders. These placeholders are then exchanged by the script to use the current time, and the interval defined by
intervalparameter in the script. - Using
now()function, in this case the query is executed as is. The interval used is the one already defined in the query and there's no need to specifyintervalin the config file.
- With epoch timestamps, in this case the timestamps are going to be changed automatically by the GitLab CI using placeholders. These placeholders are then exchanged by the script to use the current time, and the interval defined by
- OpenSearch - queries are always extracted with epoch timestamps. The timestamps are going to be replaced automatically by the GitLab CI using placeholders. These placeholders are then exchanged by the script to use the current time, and the interval defined in the script.
- Graphite - queries are executed as is. The interval used is the one already defined in the query and there's no need to specify it in the config file.
- Prometheus - The Prometheus queries don't contain time interval and the execution will be based on the interval parameters defined in the metric configuration. Please make sure that the query returns a single series of results.
- InfluxDB - has two types of queries that can be extracted:
- interval - defines the query time interval. If the interval is set to five minutes, the query will look back for data from five minutes ago until the time of the execution. Supported units are
m- minutes andh- hours. - offset_intervals - defines the number of offset time intervals the query is shifted back in time. This is very useful in case the data is expected to be available in the datsource after some delay. (e.g. If
interval:5mandoffset_intervals:2the applied time interval of the query will be between15mand10mbefore the time of the execution) - query - the query that's run to extract the values used to calculate the SLI; obtained in the following way:
- Access Grafana in your browser, change to the desired organization, and dashboard where the data is.
- For InfluxDB datasources to not have the epoch timestamps, the time must be chosen as "From: now-X" and "To: now"
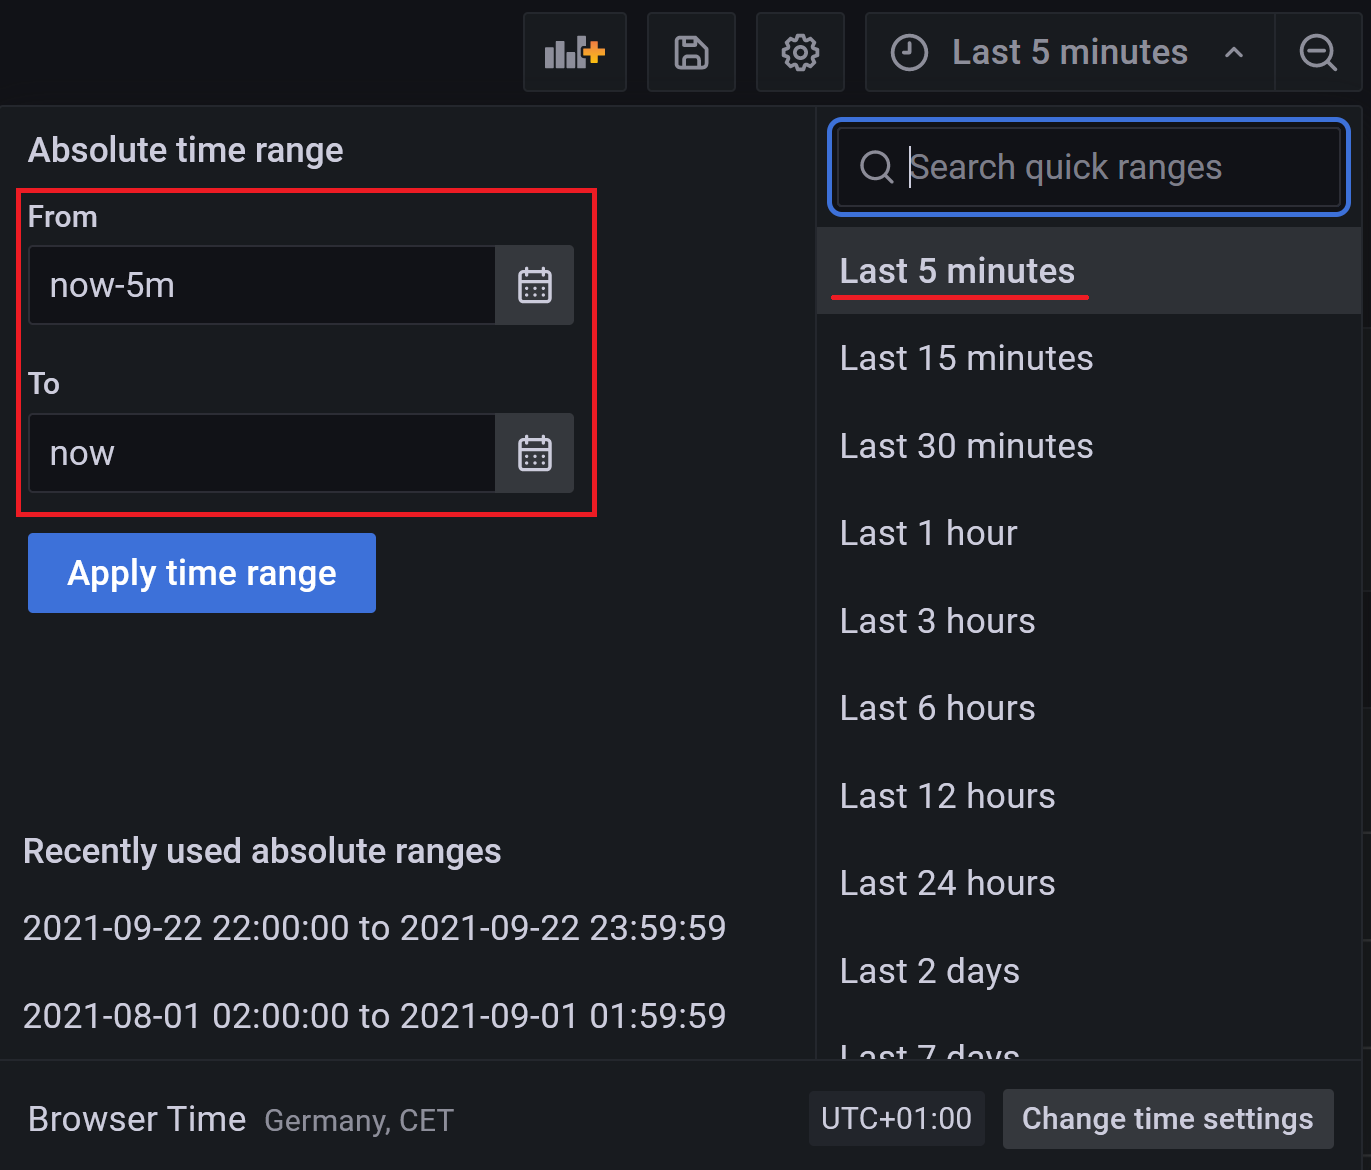
- For the case that a specific date is chosen the query will have epoch timestamps.
- For InfluxDB datasources to not have the epoch timestamps, the time must be chosen as "From: now-X" and "To: now"
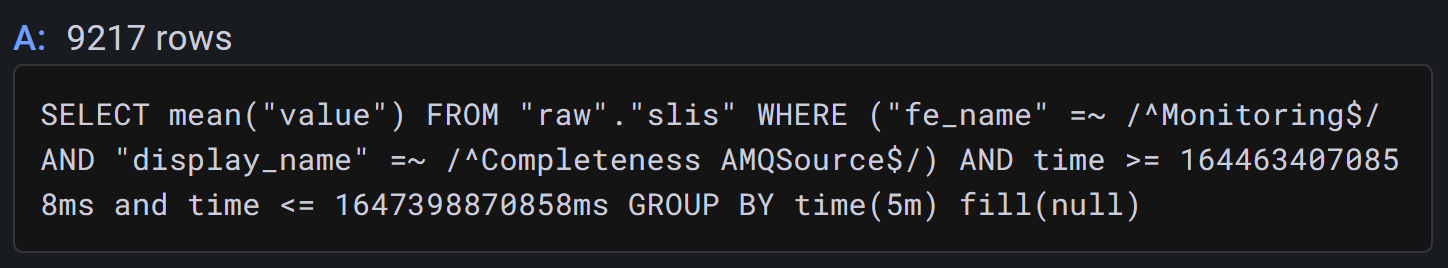
- Go to edit a panel and then press the Query inspector button.
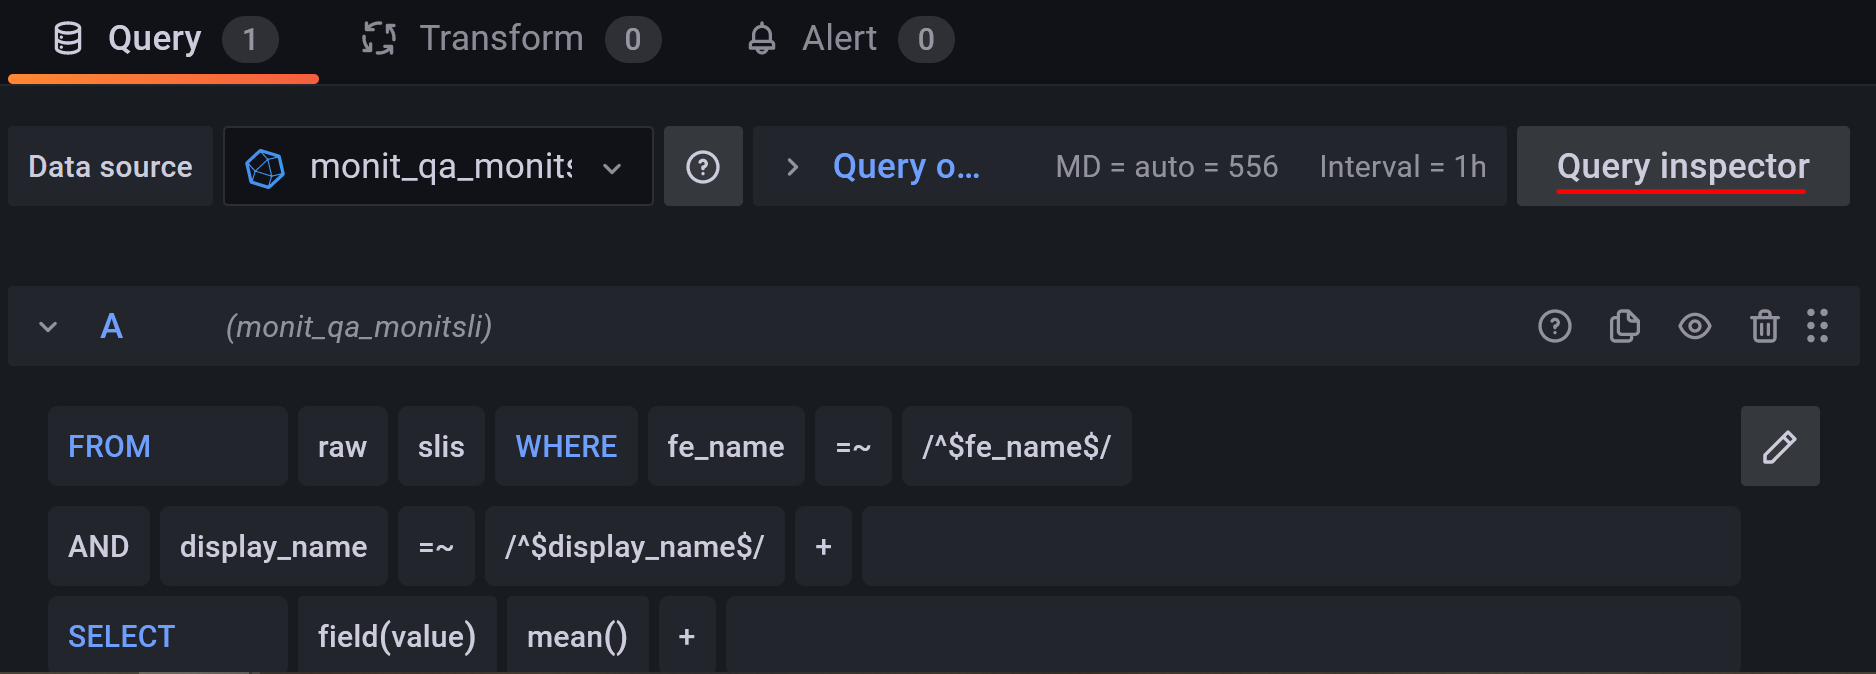
- From the side menu copy the available query and paste it on the config file.
- Access Grafana in your browser, change to the desired organization, and dashboard where the data is.
SLI fields:
- <sli name> - the name for the SLI.
- display_name - name to be displayed for the SLI in the Grafana dashboard
- fe_name - name of the functional element
- labels - (optional) static field values that will result as tags into the result SLI/SLO metrics
- <sli type> - type of SLI to be used; currently two types are supported as explained in the section above :
- basic_sli - can be calculated in two ways:
- Metric scraped is already calculated as an SLI. Considered if there is no any threshold condfiguration provided.
- The SLI will be calculated as "correct" if the value scraped by the query is either below of above respectively.
basic_sli:
    metric: condor_core_utilisation
    below_threshold: 60
- good_total_ratio - calculated by dividing the amount of good requests by the total requests to obtain the SLI value
good_total_ratio:
    good_values: good_requests
    total_values: total_requests
- basic_sli - can be calculated in two ways:
- slo_threshold - SLO threshold value used for calciualting the Error Budget
- slo_interval_days - SLO time window
- hidden -(optional) Can be either True or False, if the flag is True no data is shown created in Grafana and the data is only stored. If the field is not specified the default value will be false
Further details and examples
An example of configuration file for OpenSearch based metrics can be found below:
metrics:
  good_requests:
    org_id: 1
    datasource: monit_punch
    interval: 1m
    offset_intervals: 2
    query: |
      {"search_type":"query_then_fetch","ignore_unavailable":true,"index":["monit_prod_punch_enr_*","monit_prod_punch_enr_*"]}
      {"size":0,"query":{"bool":{"filter":[{"range":{"metadata.timestamp":{"gte":<sli_start_timestamp>,"lte":<sli_end_timestamp>,"format":"epoch_millis"}}},{"query_string":{"analyze_wildcard":true,"query":"metadata.type: haproxy AND metadata.hostgroup: punch\\/puppet\\/hap\\/*  AND data.uri_path2: catalog AND data.status: 200"}}]}},"aggs":{"3":{"terms":{"field":"data.status","size":500,"order":{"_key":"desc"},"min_doc_count":1},"aggs":{"2":{"date_histogram":{"interval":"1m","field":"metadata.timestamp","min_doc_count":0,"extended_bounds":{"min":<sli_start_timestamp>,"max":<sli_end_timestamp>},"format":"epoch_millis"},"aggs":{}}}}}}
  total_requests:
    org_id: 1
    datasource: monit_punch
    interval: 5m
    query: |
      {"search_type":"query_then_fetch","ignore_unavailable":true,"index":["monit_prod_punch_enr_*","monit_prod_punch_enr_*"]}
      {"size":0,"query":{"bool":{"filter":[{"range":{"metadata.timestamp":{"gte":<sli_start_timestamp>,"lte":<sli_end_timestamp>,"format":"epoch_millis"}}},{"query_string":{"analyze_wildcard":true,"query":"metadata.type: haproxy AND metadata.hostgroup: punch\\/puppet\\/hap\\/*  AND data.uri_path2: catalog"}}]}},"aggs":{"2":{"date_histogram":{"interval":"2m","field":"metadata.timestamp","min_doc_count":0,"extended_bounds":{"min":<sli_start_timestamp>,"max":<sli_end_timestamp>},"format":"epoch_millis"},"aggs":{}}}}

sli:
  requests:
    display_name: Successful Catalog Requests
    fe_name: Config
    good_total_ratio:
      good_values: good_requests
      total_values: total_requests
    slo_threshold: 98
    slo_interval_days: 7
An example of configuration file for influxDB based metrics can be found below:
metrics:
    completeness_amqsource:
        org_id: 45
        datasource: monit_idb_monitoring
        query: SELECT mean("value") FROM "completeness" WHERE ("category" = 'metric') AND ("name" = 'amqsource_esmonit') AND time >= now() - 6h and time <= now() GROUP BY time(1m), "name", "resource" fill(null)
    freshness_collectd:
        org_id: 45
        datasource: monit_idb_monitoring
        query: SELECT mean("value") FROM "raw"."freshness" WHERE ("category" = 'metric') AND  ("resource" = 'collectd') AND time >= now() - 6h and time <= now() GROUP BY time(1m), "resource" fill(null)

sli:
    completeness_amqsource:
        display_name: Completeness AMQSource
        fe_name: Monitoring
        labels:
            sli_type: completeness
            data_flow: amqsource_esmonit
            data_flow_type: metrics
        good_total_ratio:
            good_values: completeness_amqsource
            total_values: 250
        slo_threshold: 99
        slo_interval_days: 1
    freshness_collectd:
        display_name: Freshness Collectd
        fe_name: Monitoring
        labels:
            sli_type: freshness
            data_flow_type: collectd
        basic_sli:
            metric: freshness_collectd
            below_threshold: 60
        slo_threshold: 98
        slo_interval_days: 1
An example of configuration file for Graphite based metrics can be found below:
metrics:
    condor_core_utilisation:
        org_id: 1
        datasource: fifemon-graphite
        interval_minutes: 5
        query: |
            target=scale(summarize(removeAboveValue(divideSeries(sumSeries(aliasByNode(exclude(transformNull(keepLastValue(clusters.*.jobs.totals.running.totals.cpu_request%2C%20100)%2C%200)%2C%20'none')%2C%204))%2C%20sumSeries(aliasByNode(exclude(transformNull(keepLastValue(clusters.*.slots.Partitionable.totals.TotalCpus%2C%20100)%2C%200)%2C%20'none')%2C%204)))%2C%201)%2C%20'12h'%2C%20'avg'%2C%20false)%2C100)&from=-1d&until=now&format=json&maxDataPoints=100

sli:
    condor_core_utilisation:
        display_name: HTCondor - Core Utilisation
        fe_name: Batch
        basic_sli:
            metric: condor_core_utilisation
        slo_threshold: 98
        slo_interval_days: 14
An example of configuration file for Prometheus based metrics can be found below:
metrics:
  prometheus_test:
    datasource: monit_prometheus_mom
    org_id: 45
    interval: 5m
    query: avg by (hostgroup) (collectd_flume_flume_channel_channel_fill_percentage{hostgroup=~\"monitoring/flume/amqsource\",environment=~\"production\",type=~\".*.*.*\"})

sli:
  prometheus_test:
    display_name: Prometheus Flume example
    fe_name: Monitoring
    basic_sli:
      metric: prometheus_test
      below_threshold: 2
    slo_interval_days: 7
    slo_threshold: 98