Grafana Alarms
Grafana Unified Alerting
In Grafana an alarm is created using the alerting engine.
NOTE: Grafana provides configuration and status information about existing alerts in Prometheus datasources. Please note that all such alerts are READ ONLY and Grafana is not processing any execution or notifications regarding them.
Alert Rules
Grafana supports creating alert rules directly from existing panels or through the Alerting menu.
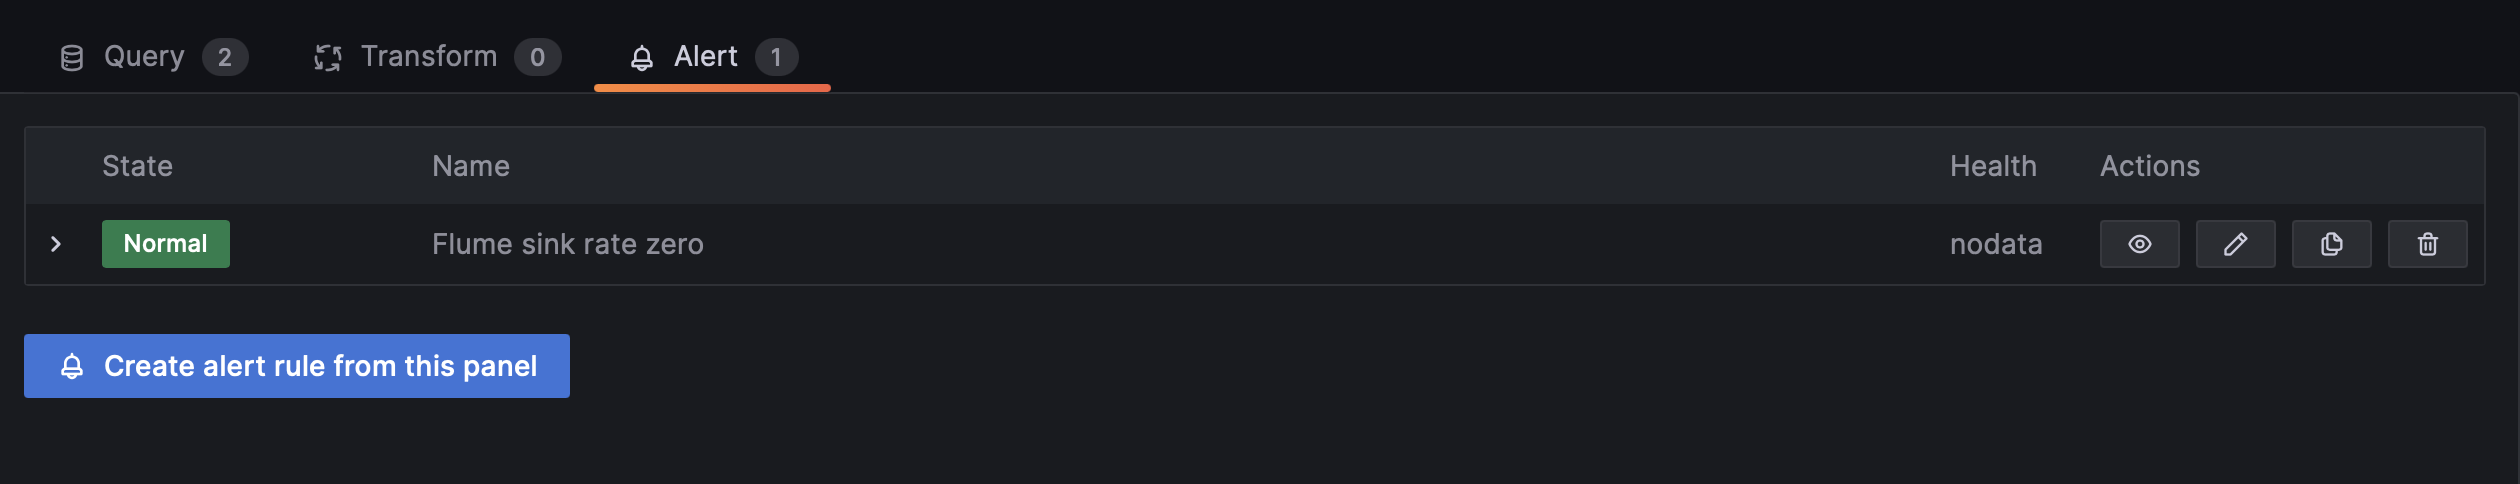
By using an existing panel you can create the alert rule through the button "Create alert rule from this panel" that can be found under the "Alert" section in the panel Edit mode. Once created the alert rule definition will be predefined with the queries already existing for the corresponding panel.
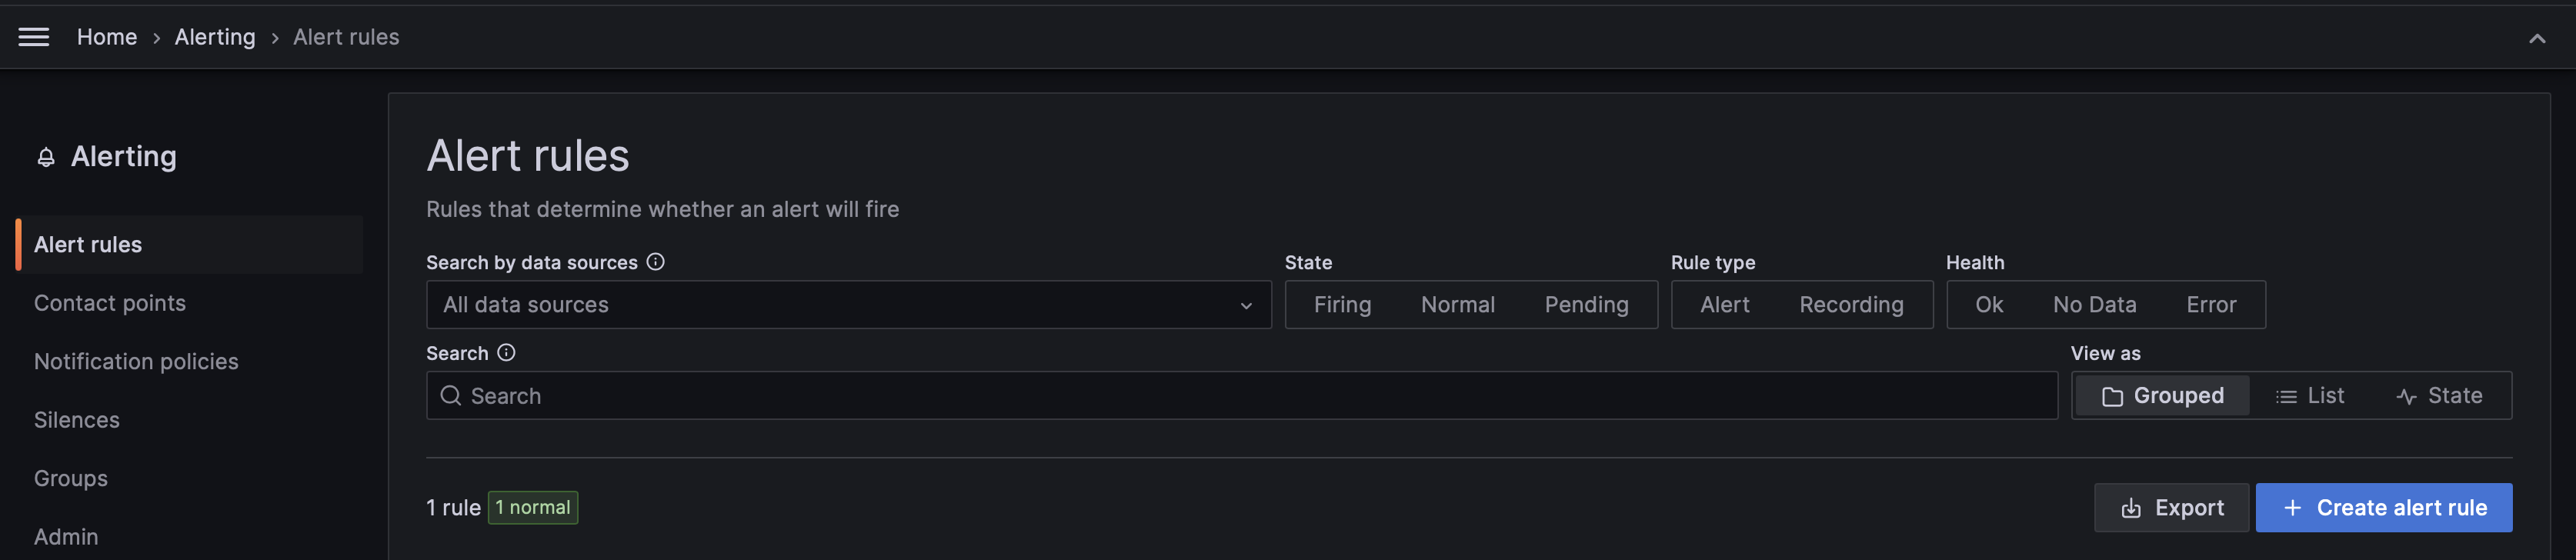
By using the "Alerting" menu alerts can be created from the "Create alert rule" button and the rule definition will be completely empty.
For creating an alert rule, the following configuration steps should be completed:
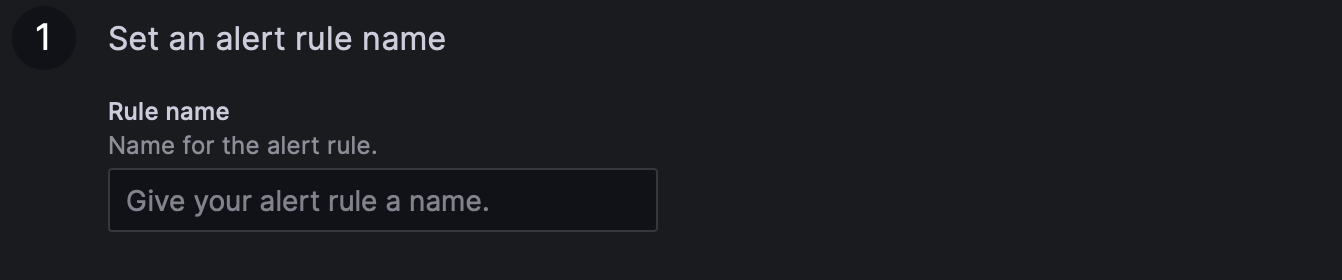
Alert Name
Set the name of the alert rule.
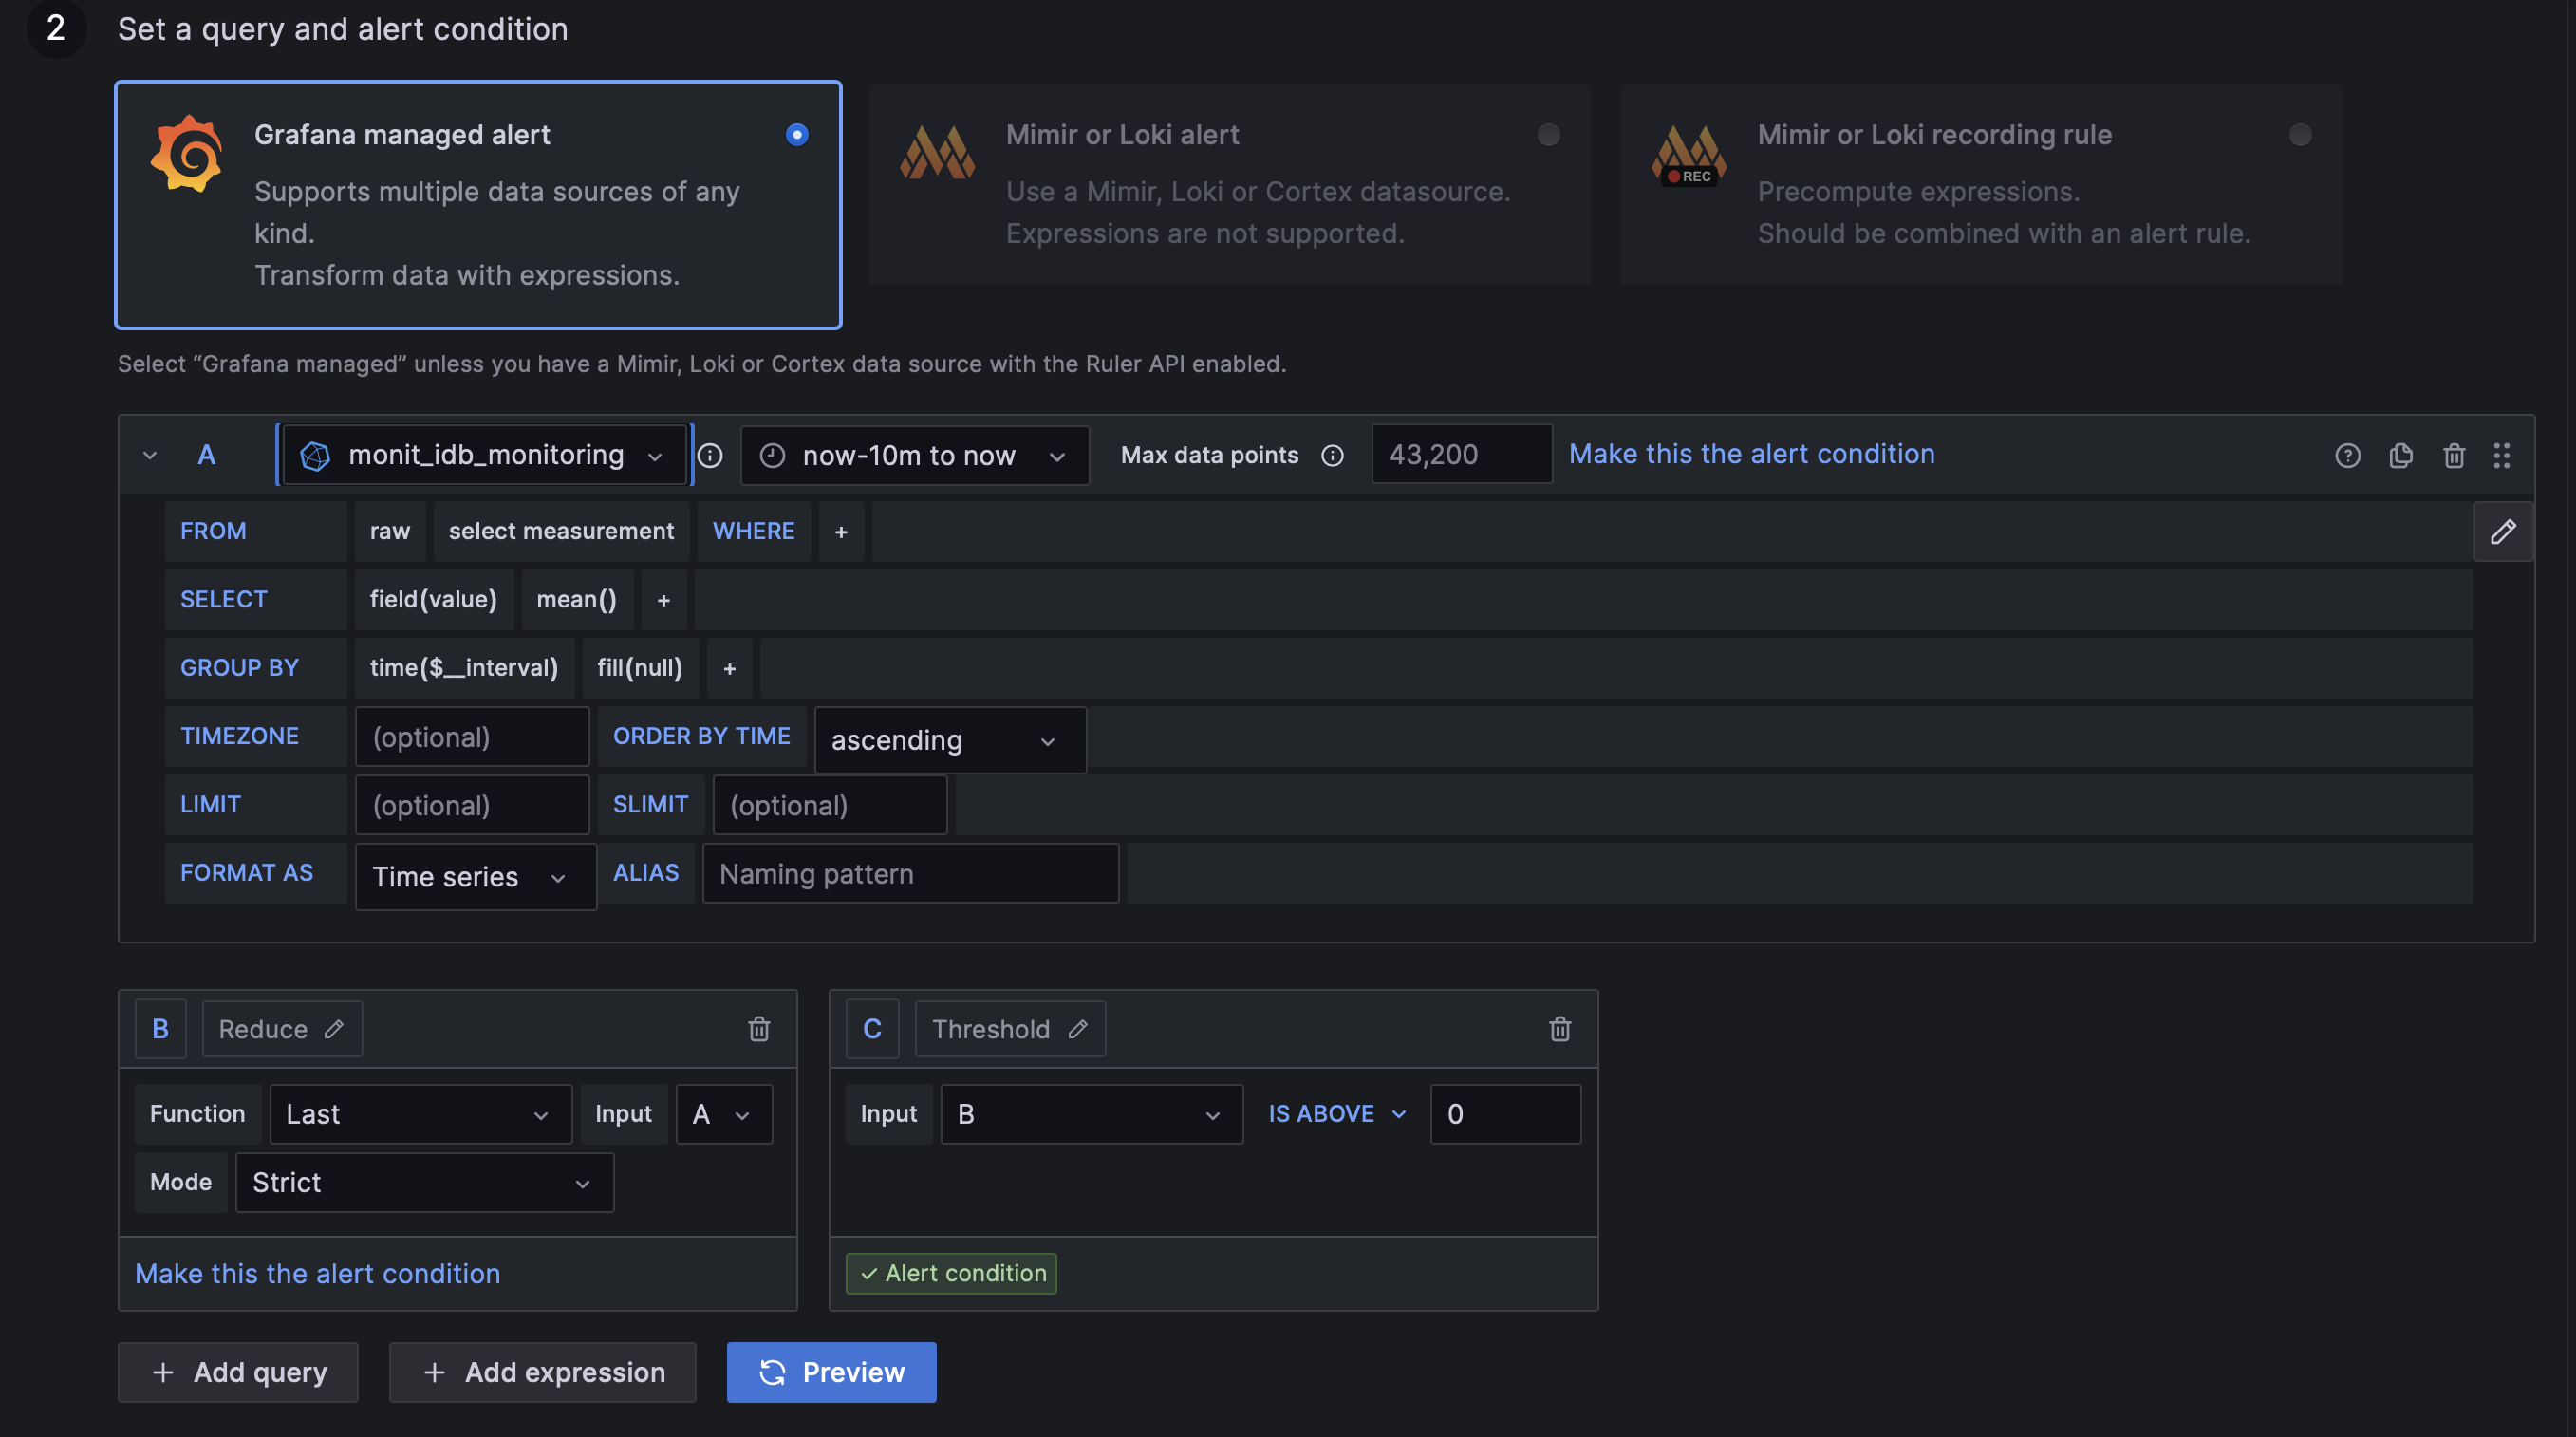
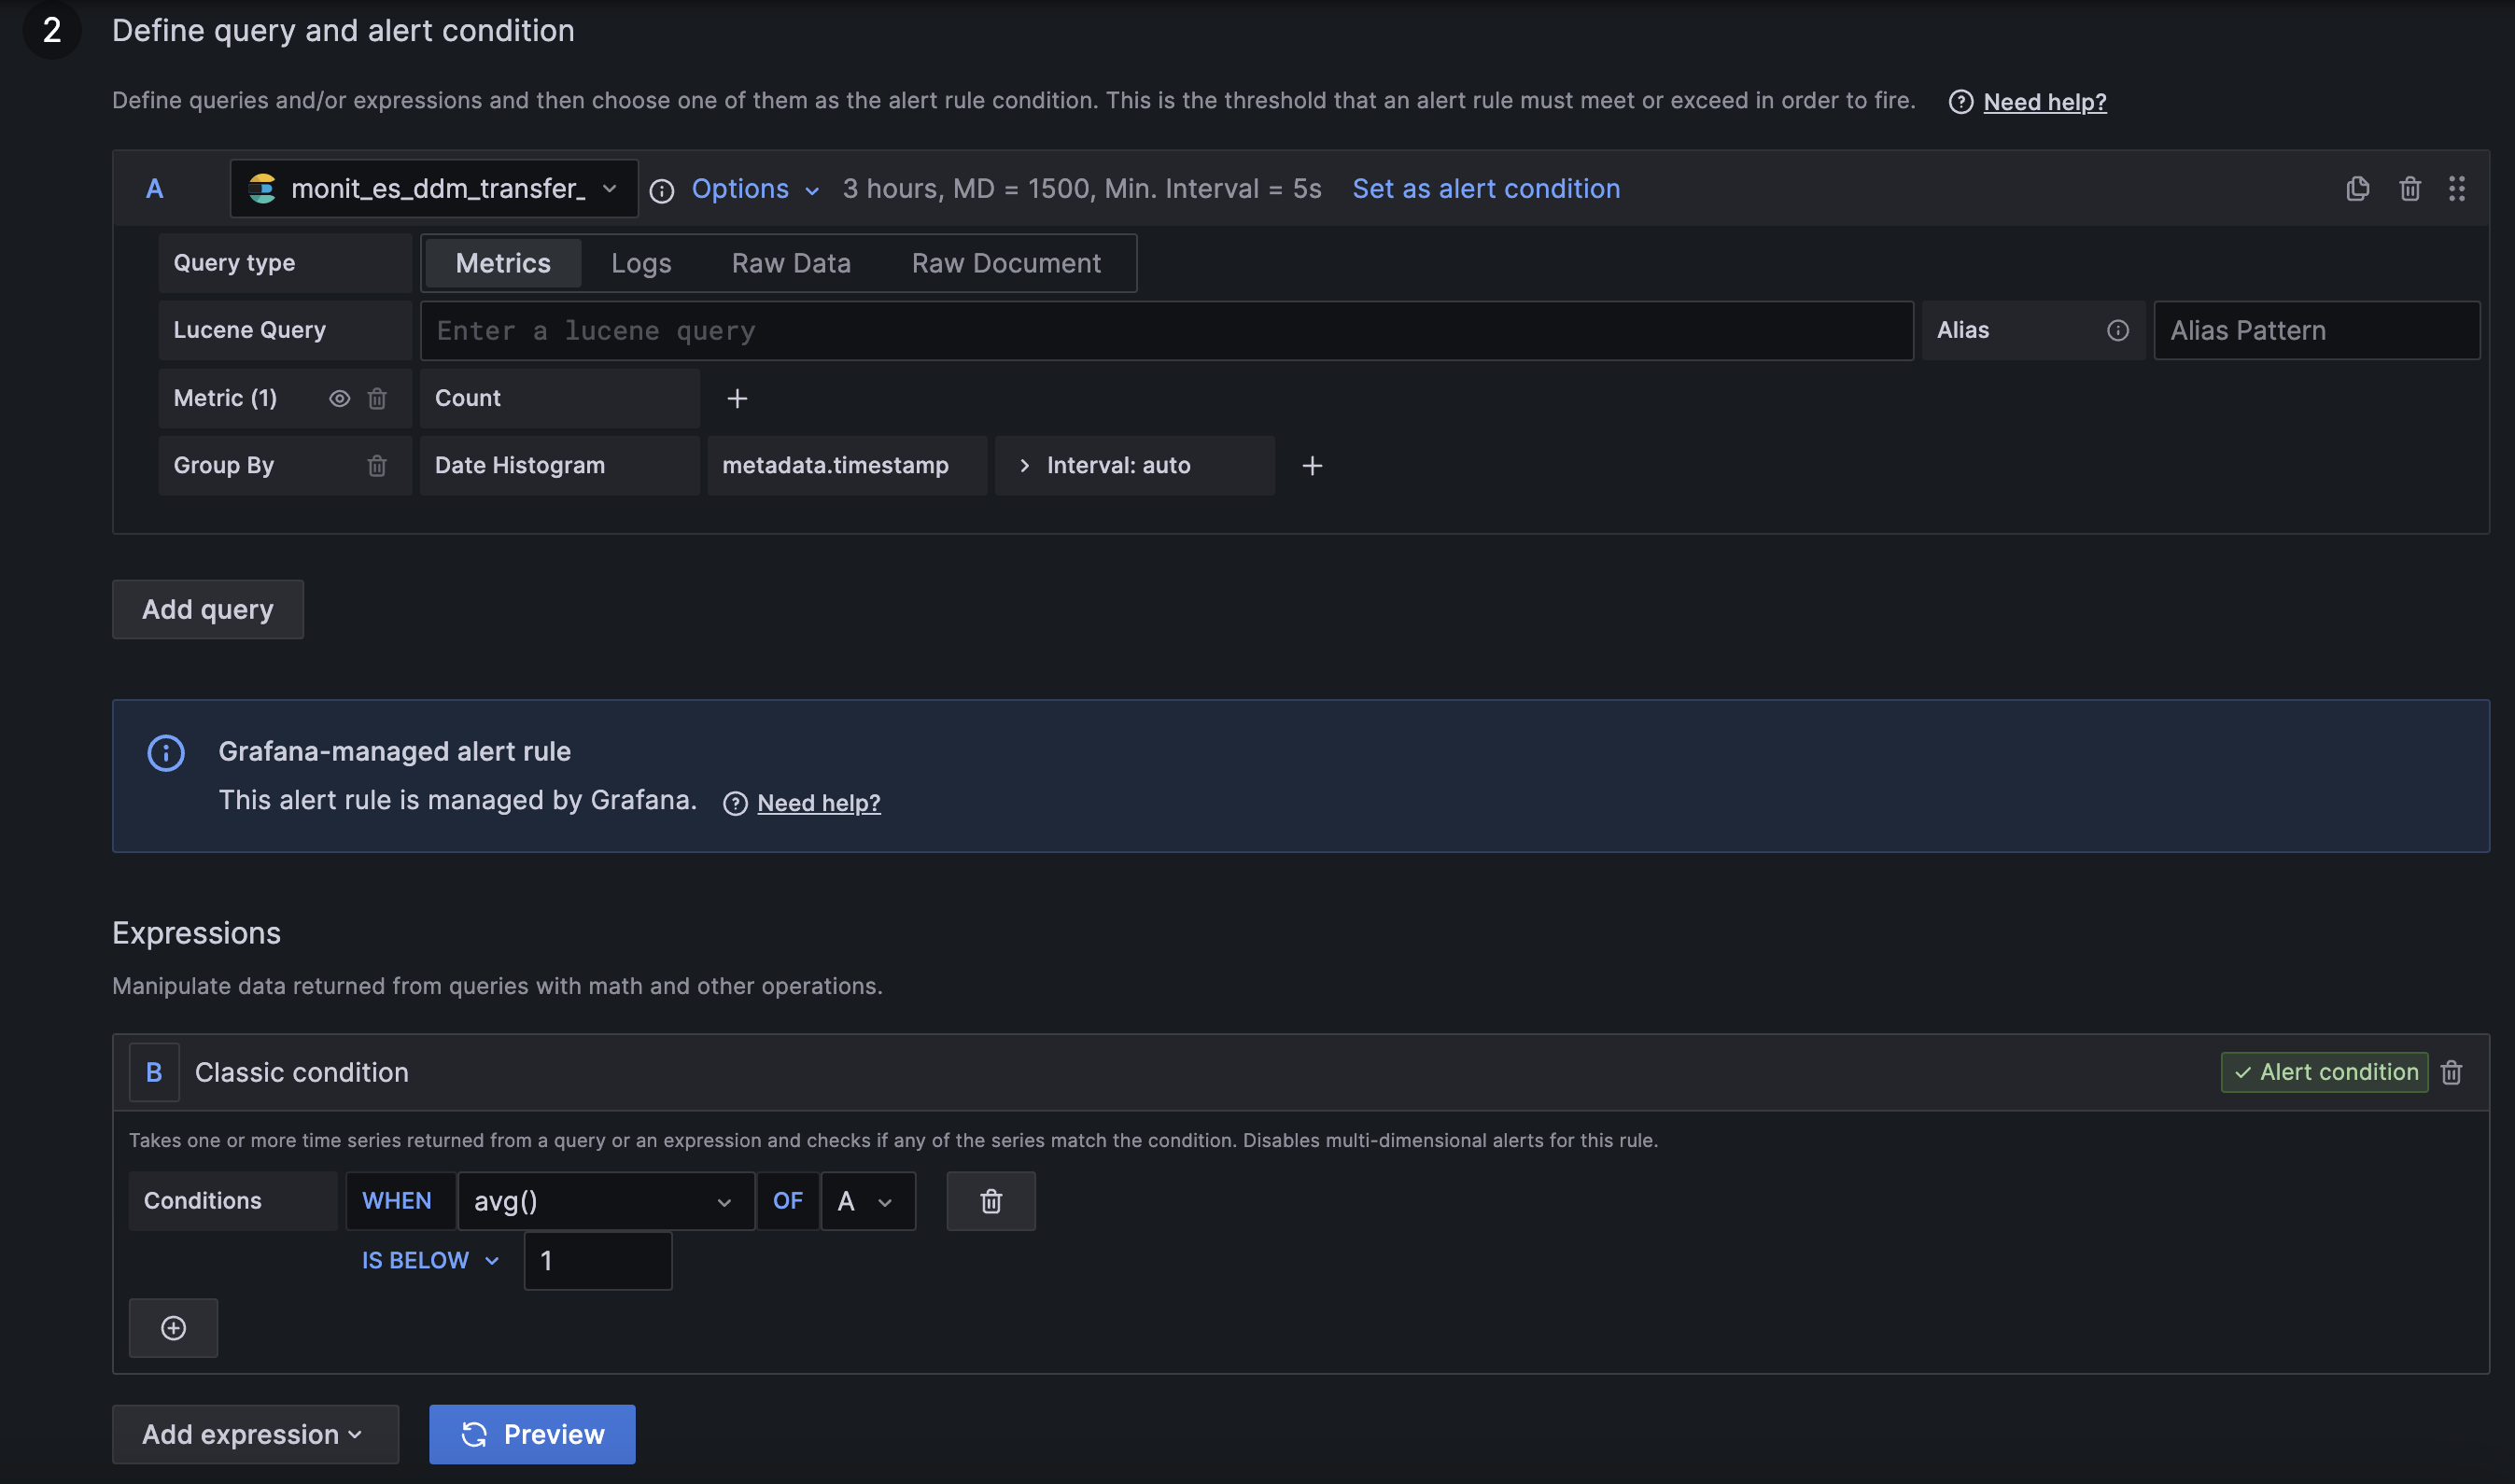
Query and alert conditions
In this section you need to provide the data query and the required expressions for evaluating the result. The query definition is similar to the one used for the plots, where you need to select the datasource and define the query predicates depending on the datasource type. The expression can be one of the following types: - Math - Reduce - Resample - Threshold - Classic condition
Different expressions can be chained in order with the "Threshold" and "Classic condition" being the only ones that can be used for "final" condition defining the alert status, and the rest used for data transformation only. More details about the actual expressions could be found in their in-panel hints and Grafana docs
At this stage you can also preview the result of the query and the conditions before even saving the alert by using the "Preview" button.
NOTE: We strongly recommend using the "Threshold" expression for alert state evaluation in general and in particular for multi-instance alerts. The "Classic condition" is mainly used for migration of existing alerts from the previous Legacy Alerting format and it doesn't provide all the functionality supported by the new framework.
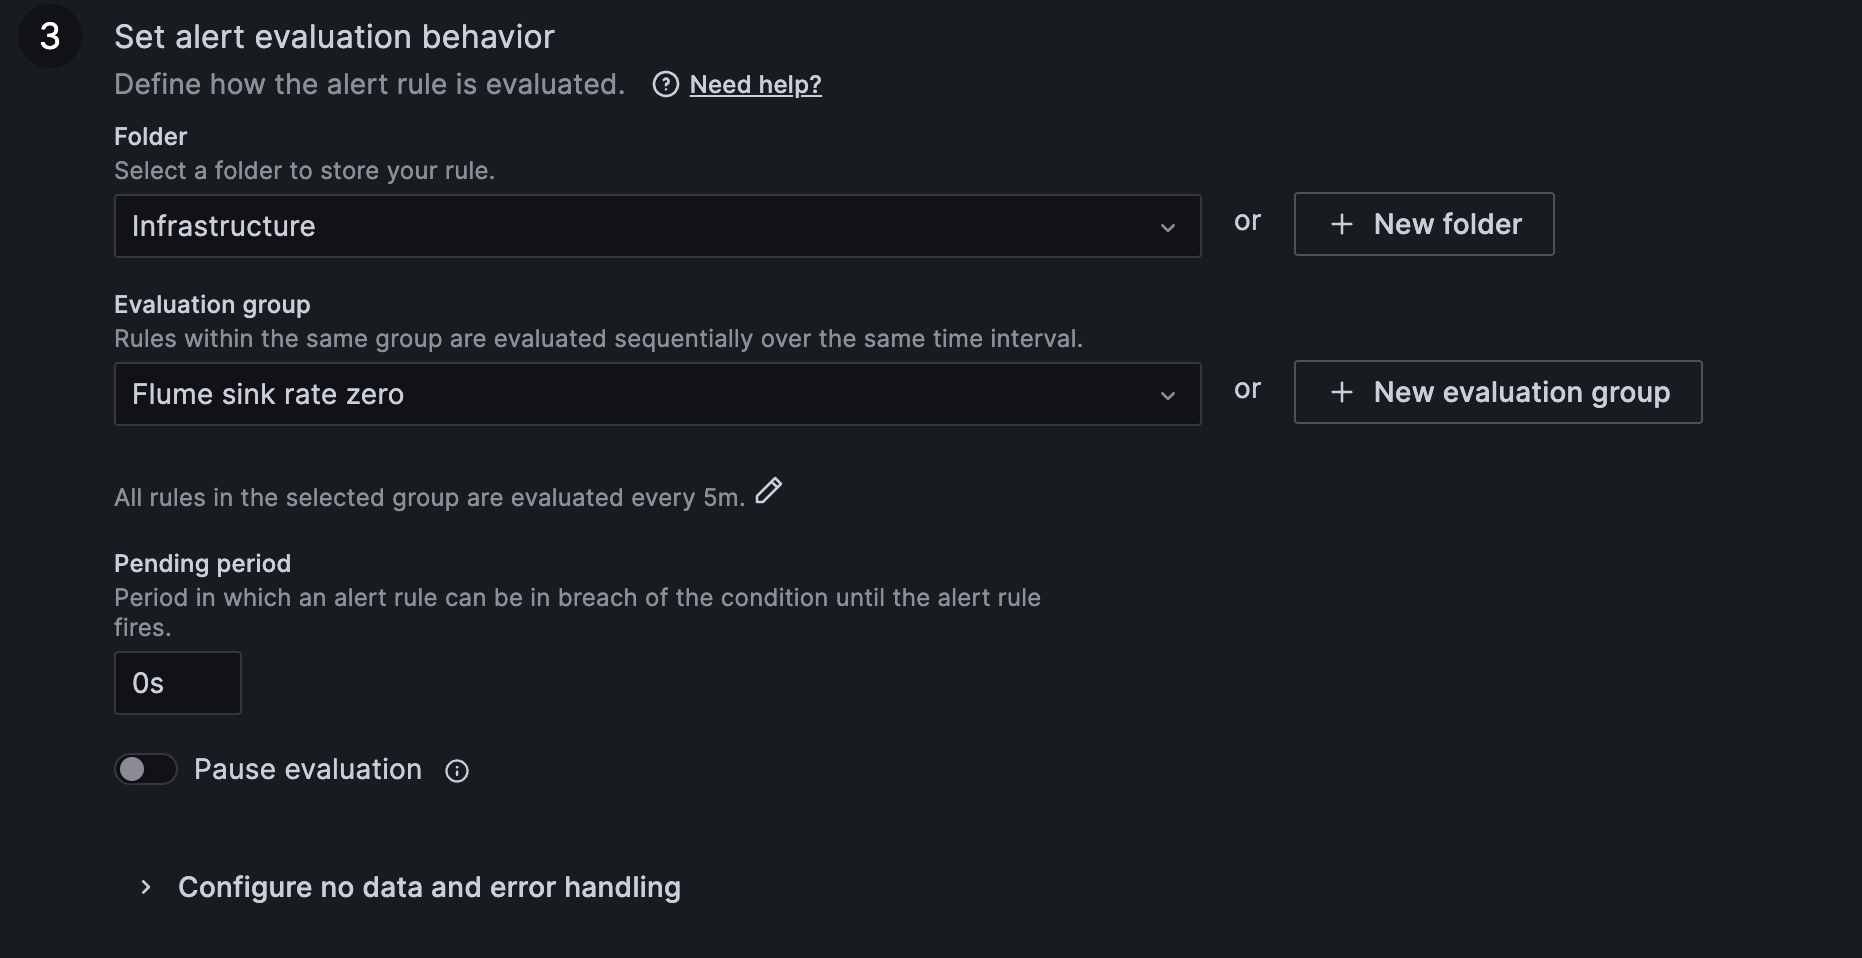
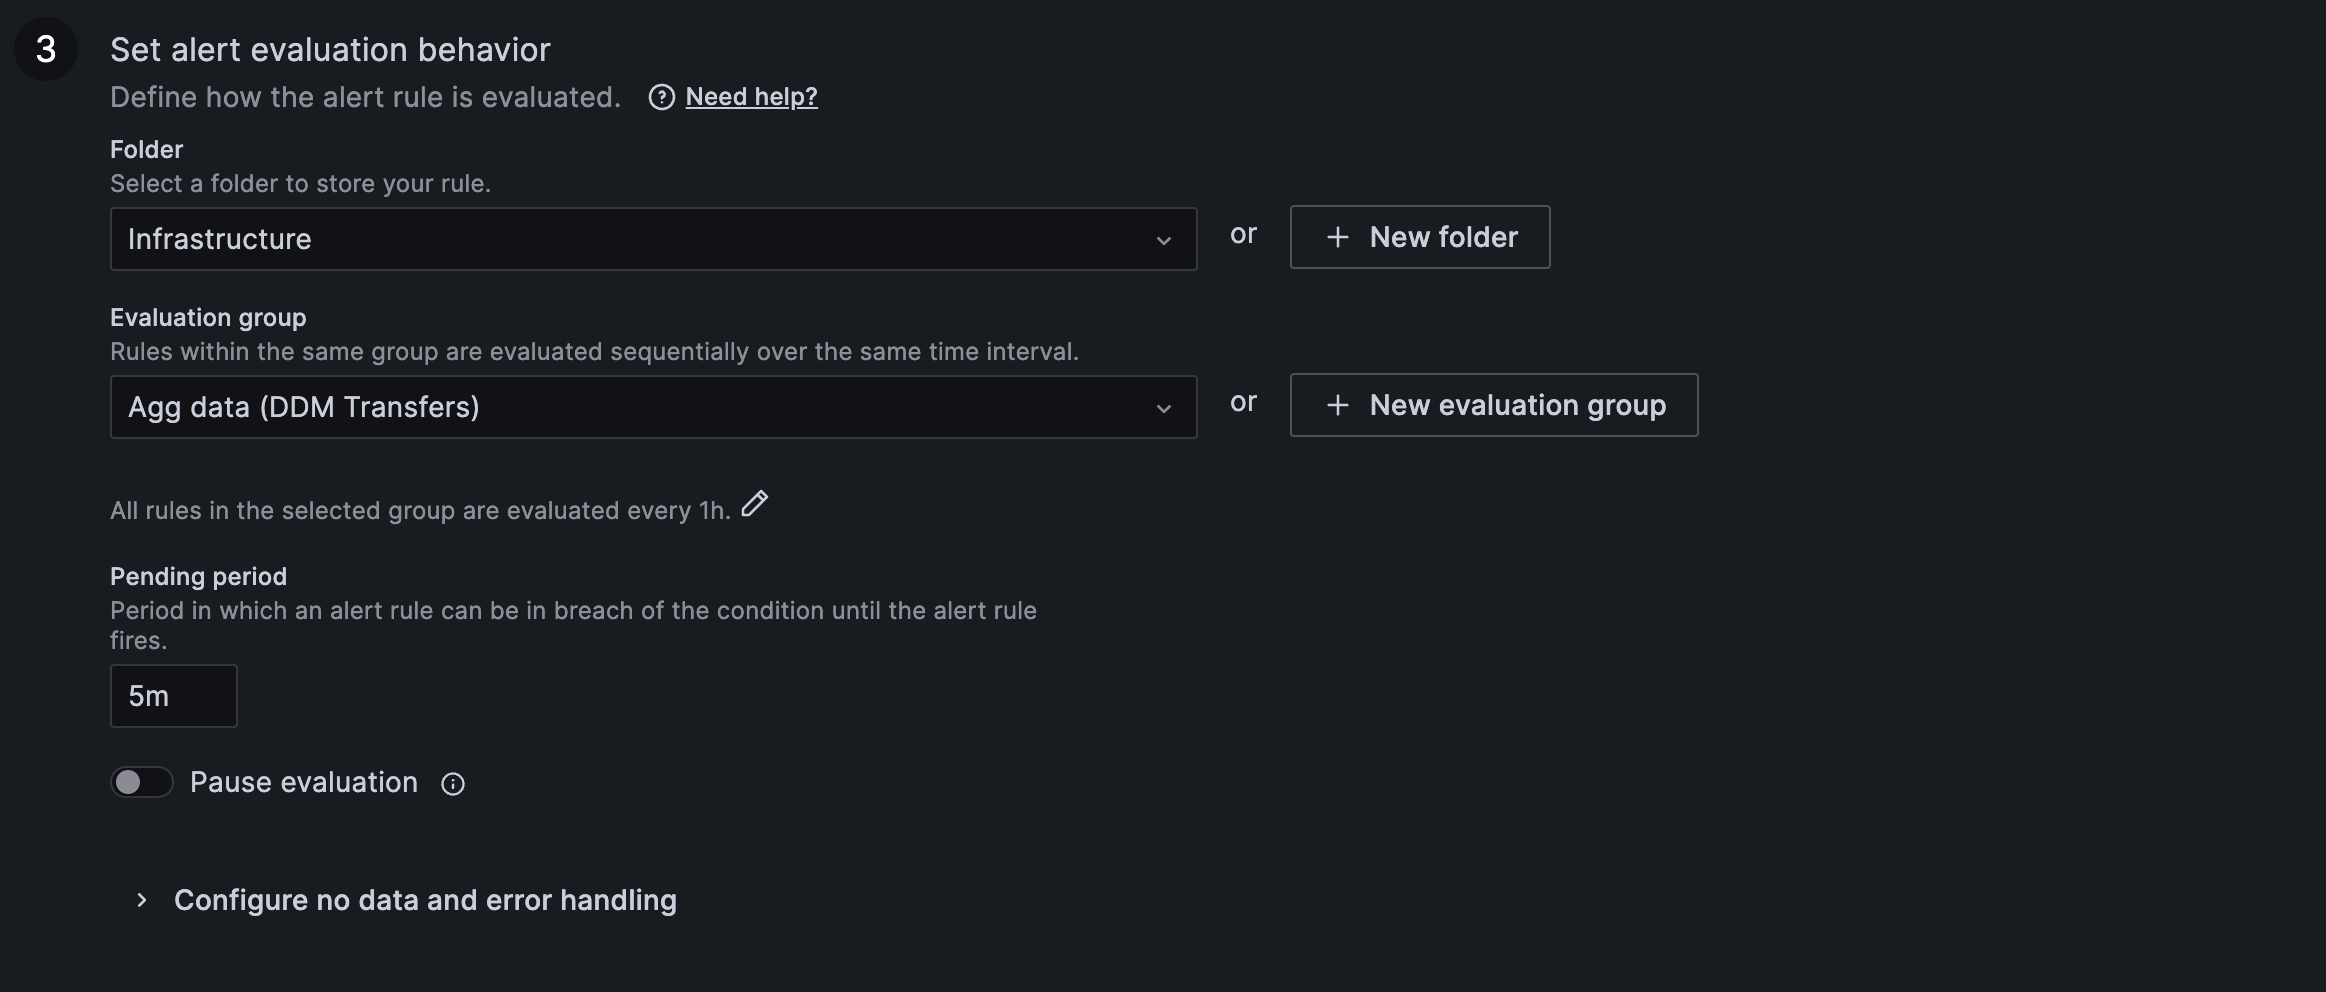
Alert evaluation behaviour
This section allows configuring how often the alert condition will be evaluated and what the alerting behaviour will be in case of missing data or query failure. It supports creation of evaluation groups allowing for easier configuration changes to alerts belonging to the same group. It provides also "Pause evaluation" option that allows excluding your alert while working on the query or expressions tune up.
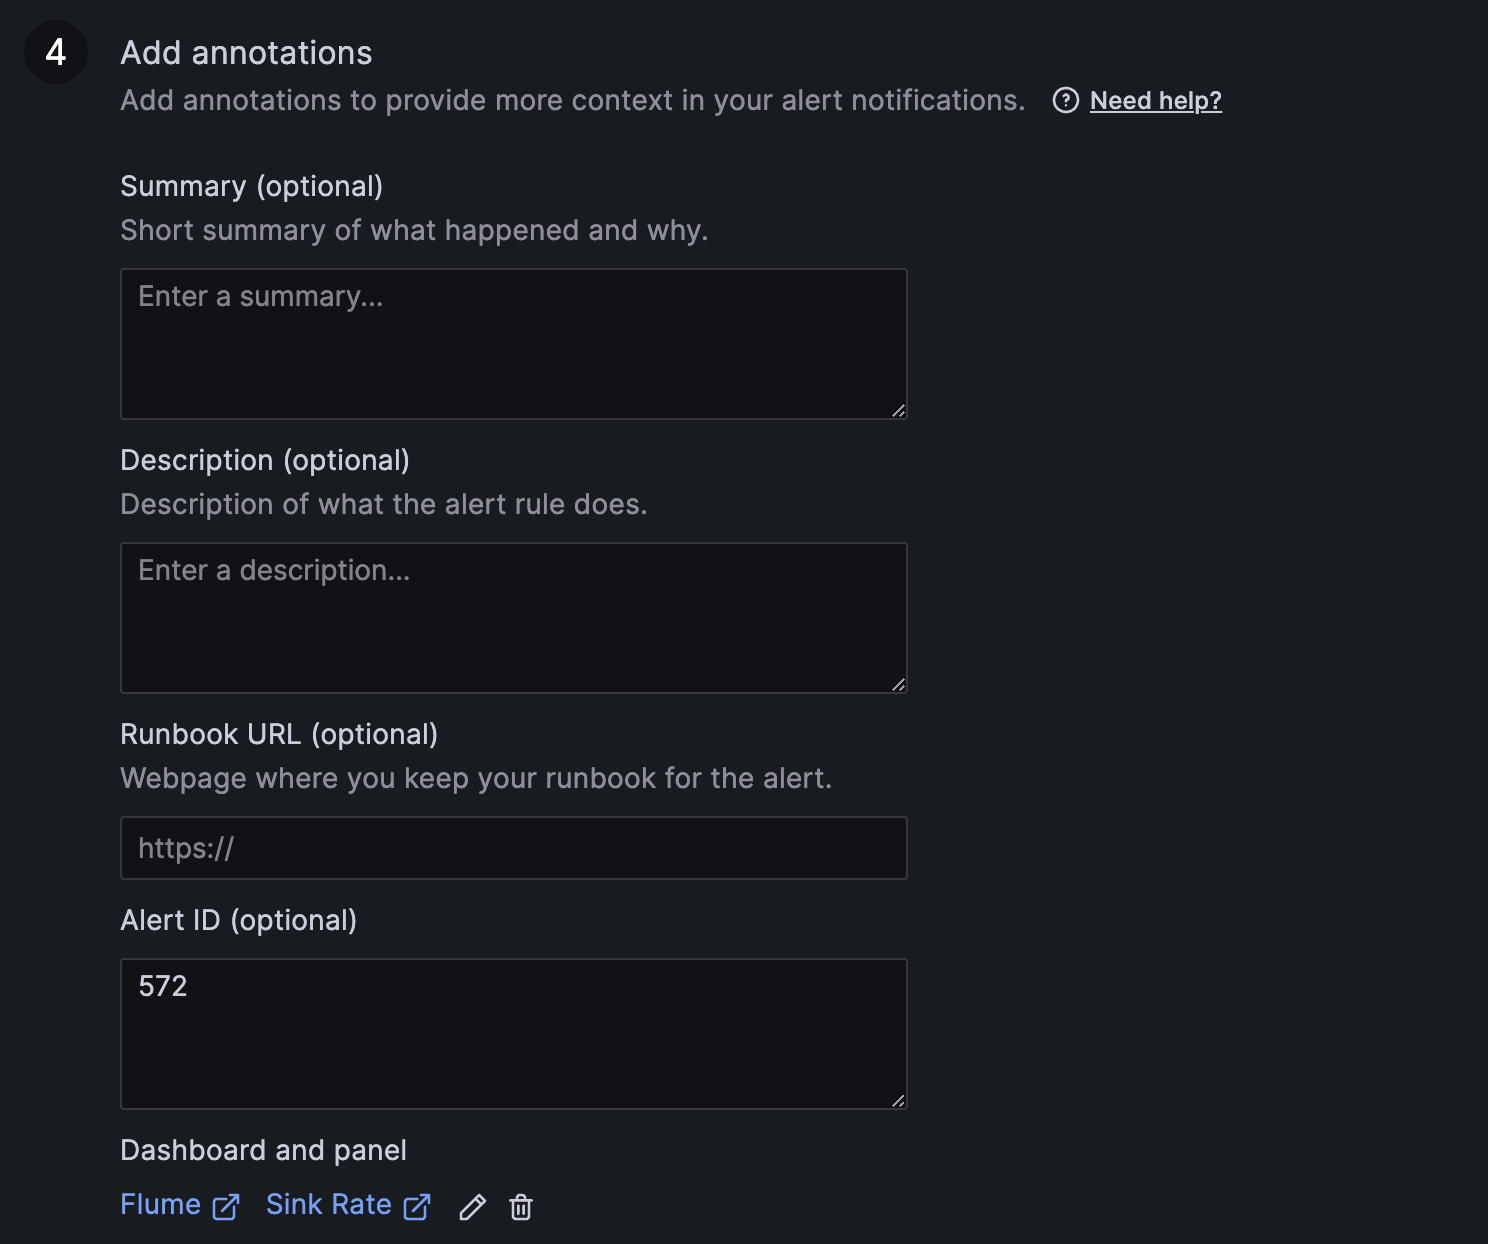
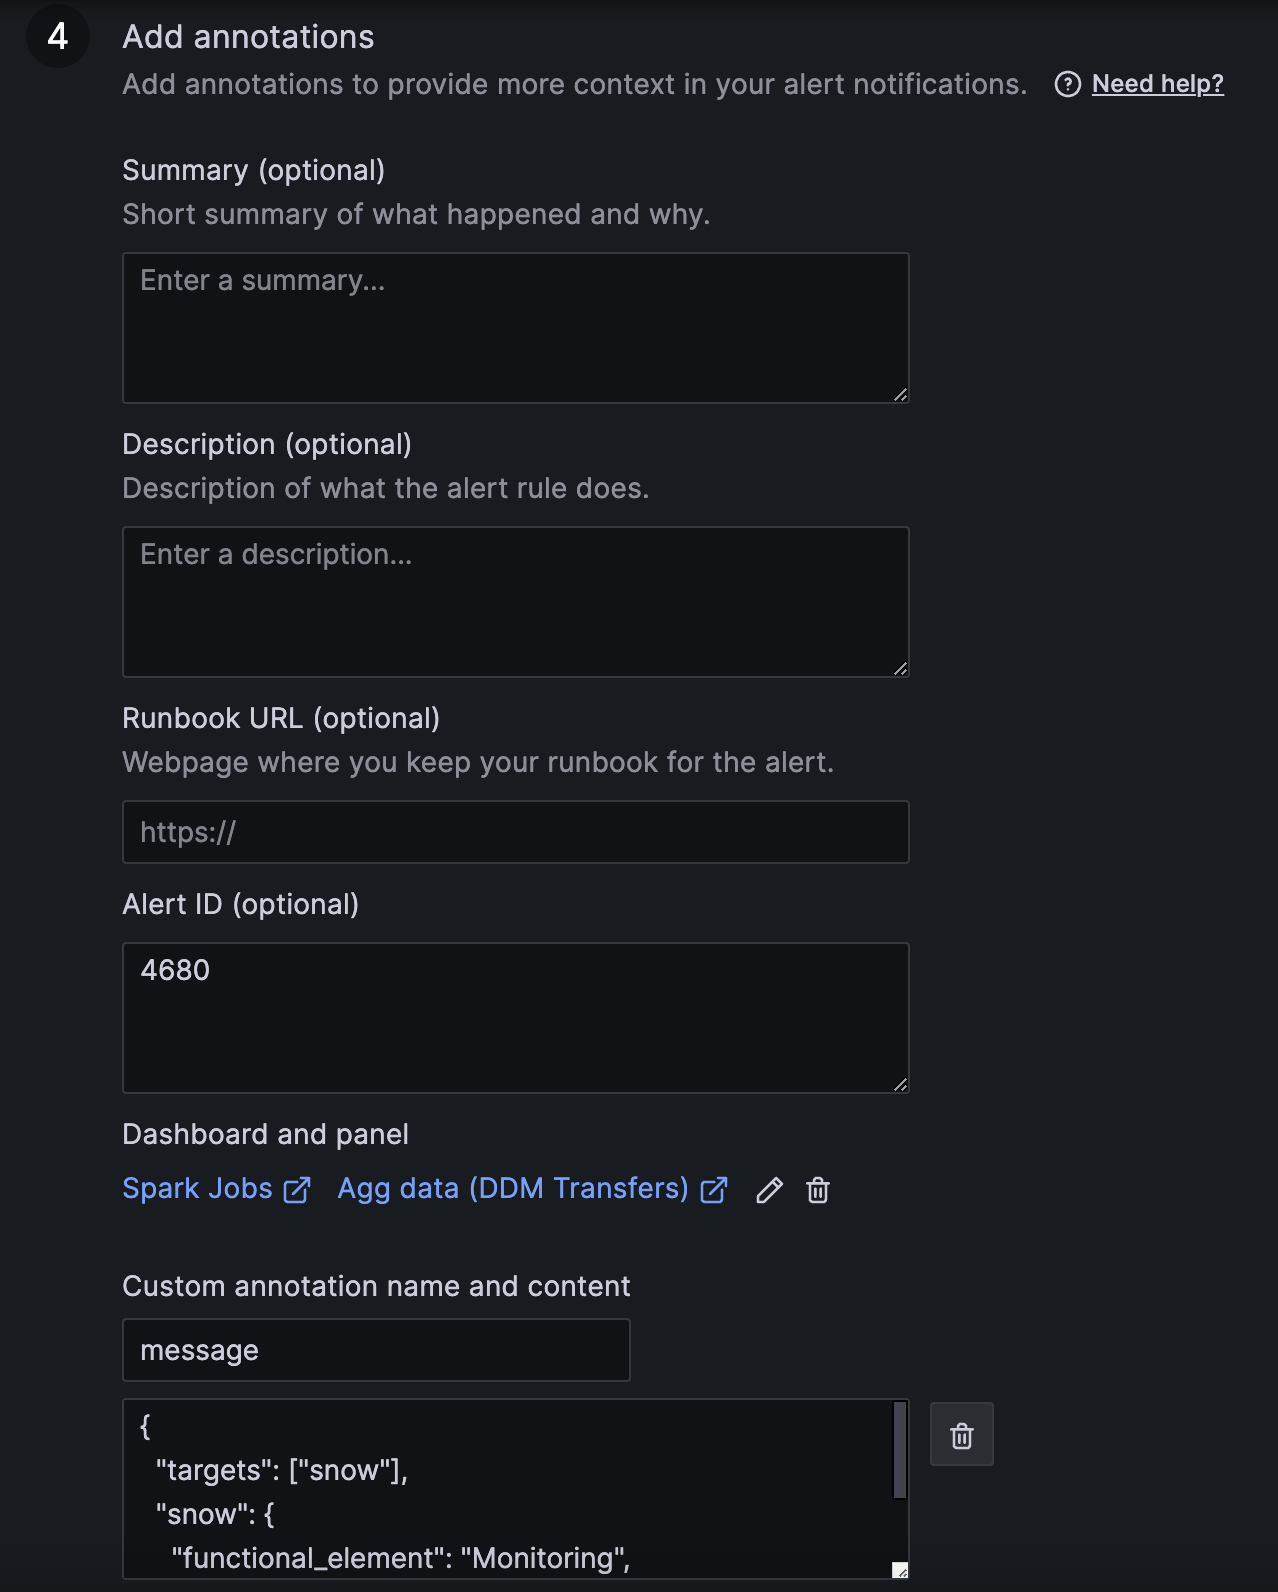
Alert rule annotations
This section allows adding or editing alert annotations. There are predefined fields in Grafana like Summary, Description, Alert ID, etc., but you can also add any custom ones through the "Add custom annotation" button.
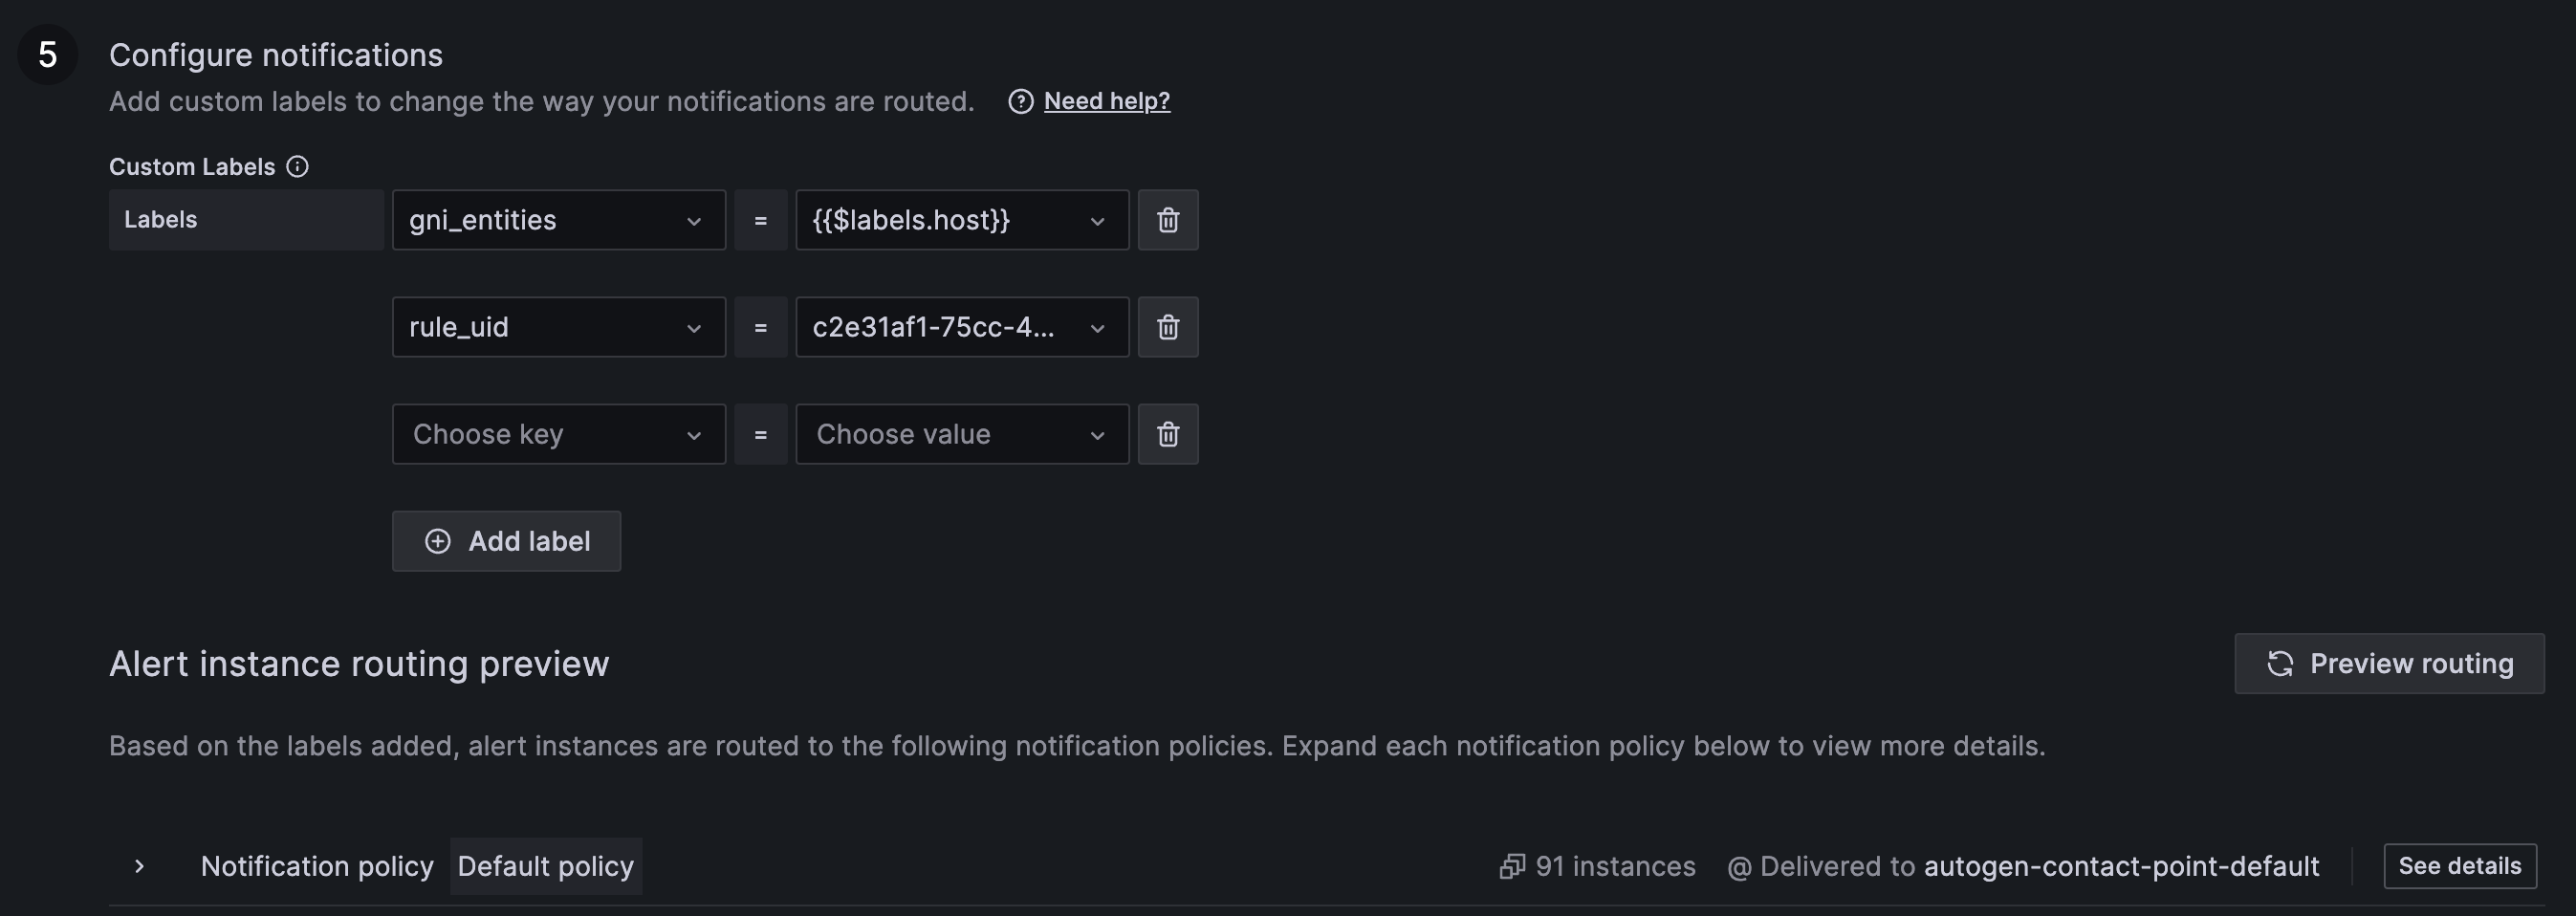
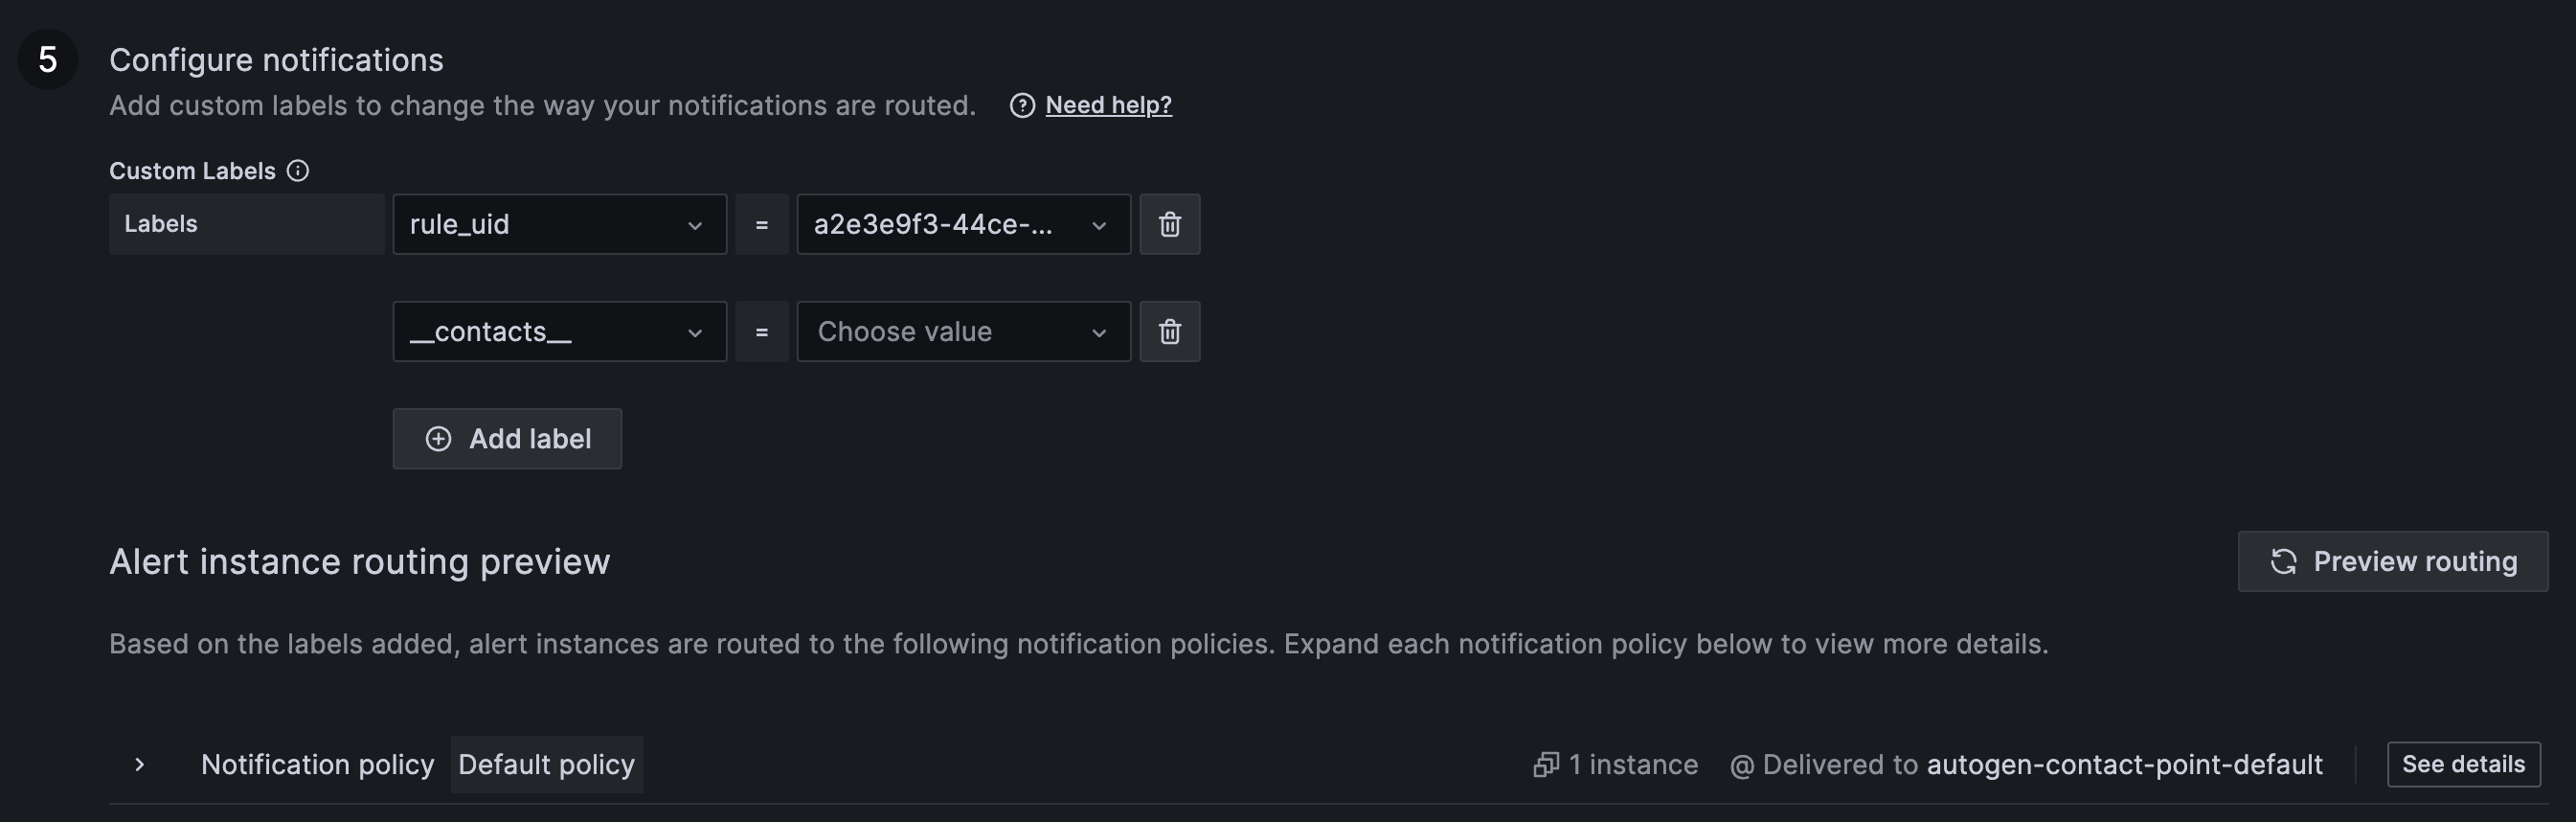
Alert rule notifications
In the "Notification" section you can define the alert labels. They are used for notification policy assignment as well as for MONIT GNI integration described in a dedicated "SNOW Integration" section below. Preview routing option is avaiable in order to check all the contact points the alert will be assigned to based on the defined set of labels.
Alert notifications
Grafana Unified Alerting is using a concept of notification policies and contact points in order to route alerts and notify the recepients.
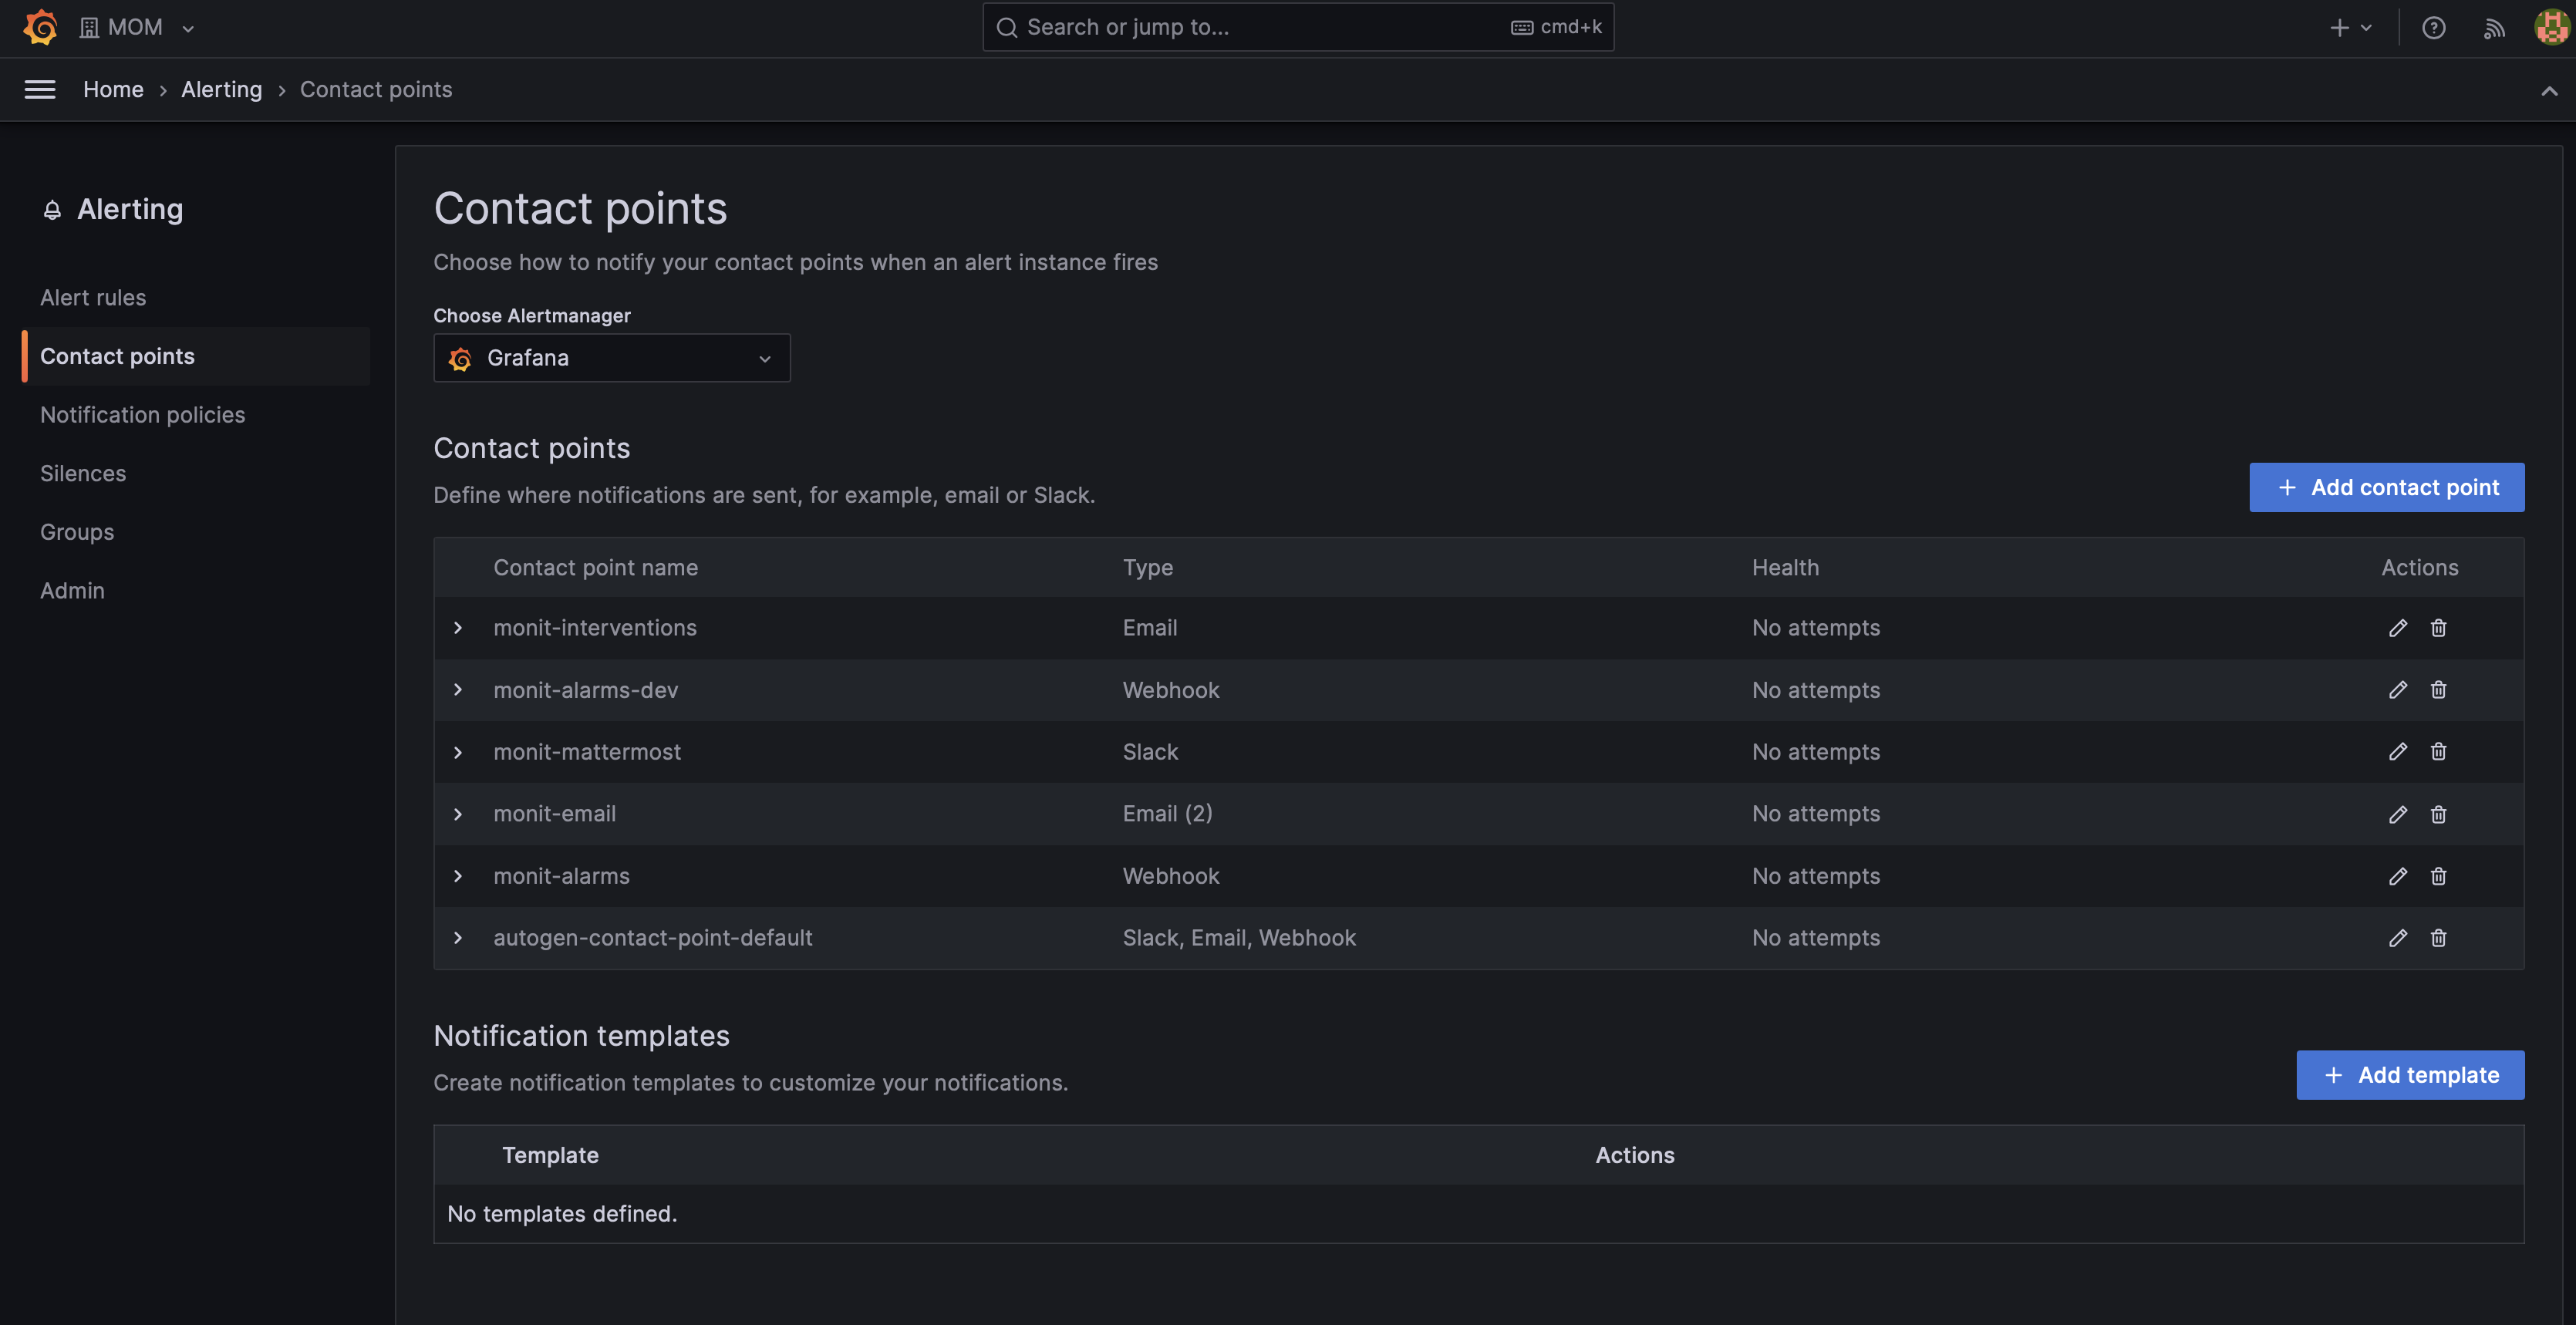
Contact Points
Contact points are definitions of endpoints that should be notified following an alert status change and they can be defined from the "Contact points" menu under the Alerting section. MONIT Grafana supports the following contact point types: Email, Webhook and Slack (for Mattermost integration). The contact points are created per organization and should be managed by the admin of the particular organization.
For MONIT integration you will need to have a webhook contact point configured to URL: http://monit-alarms.cern.ch:10016 If SNOW GNI integration is required, please configure the specific labels as explained in the "SNOW integration" section below.
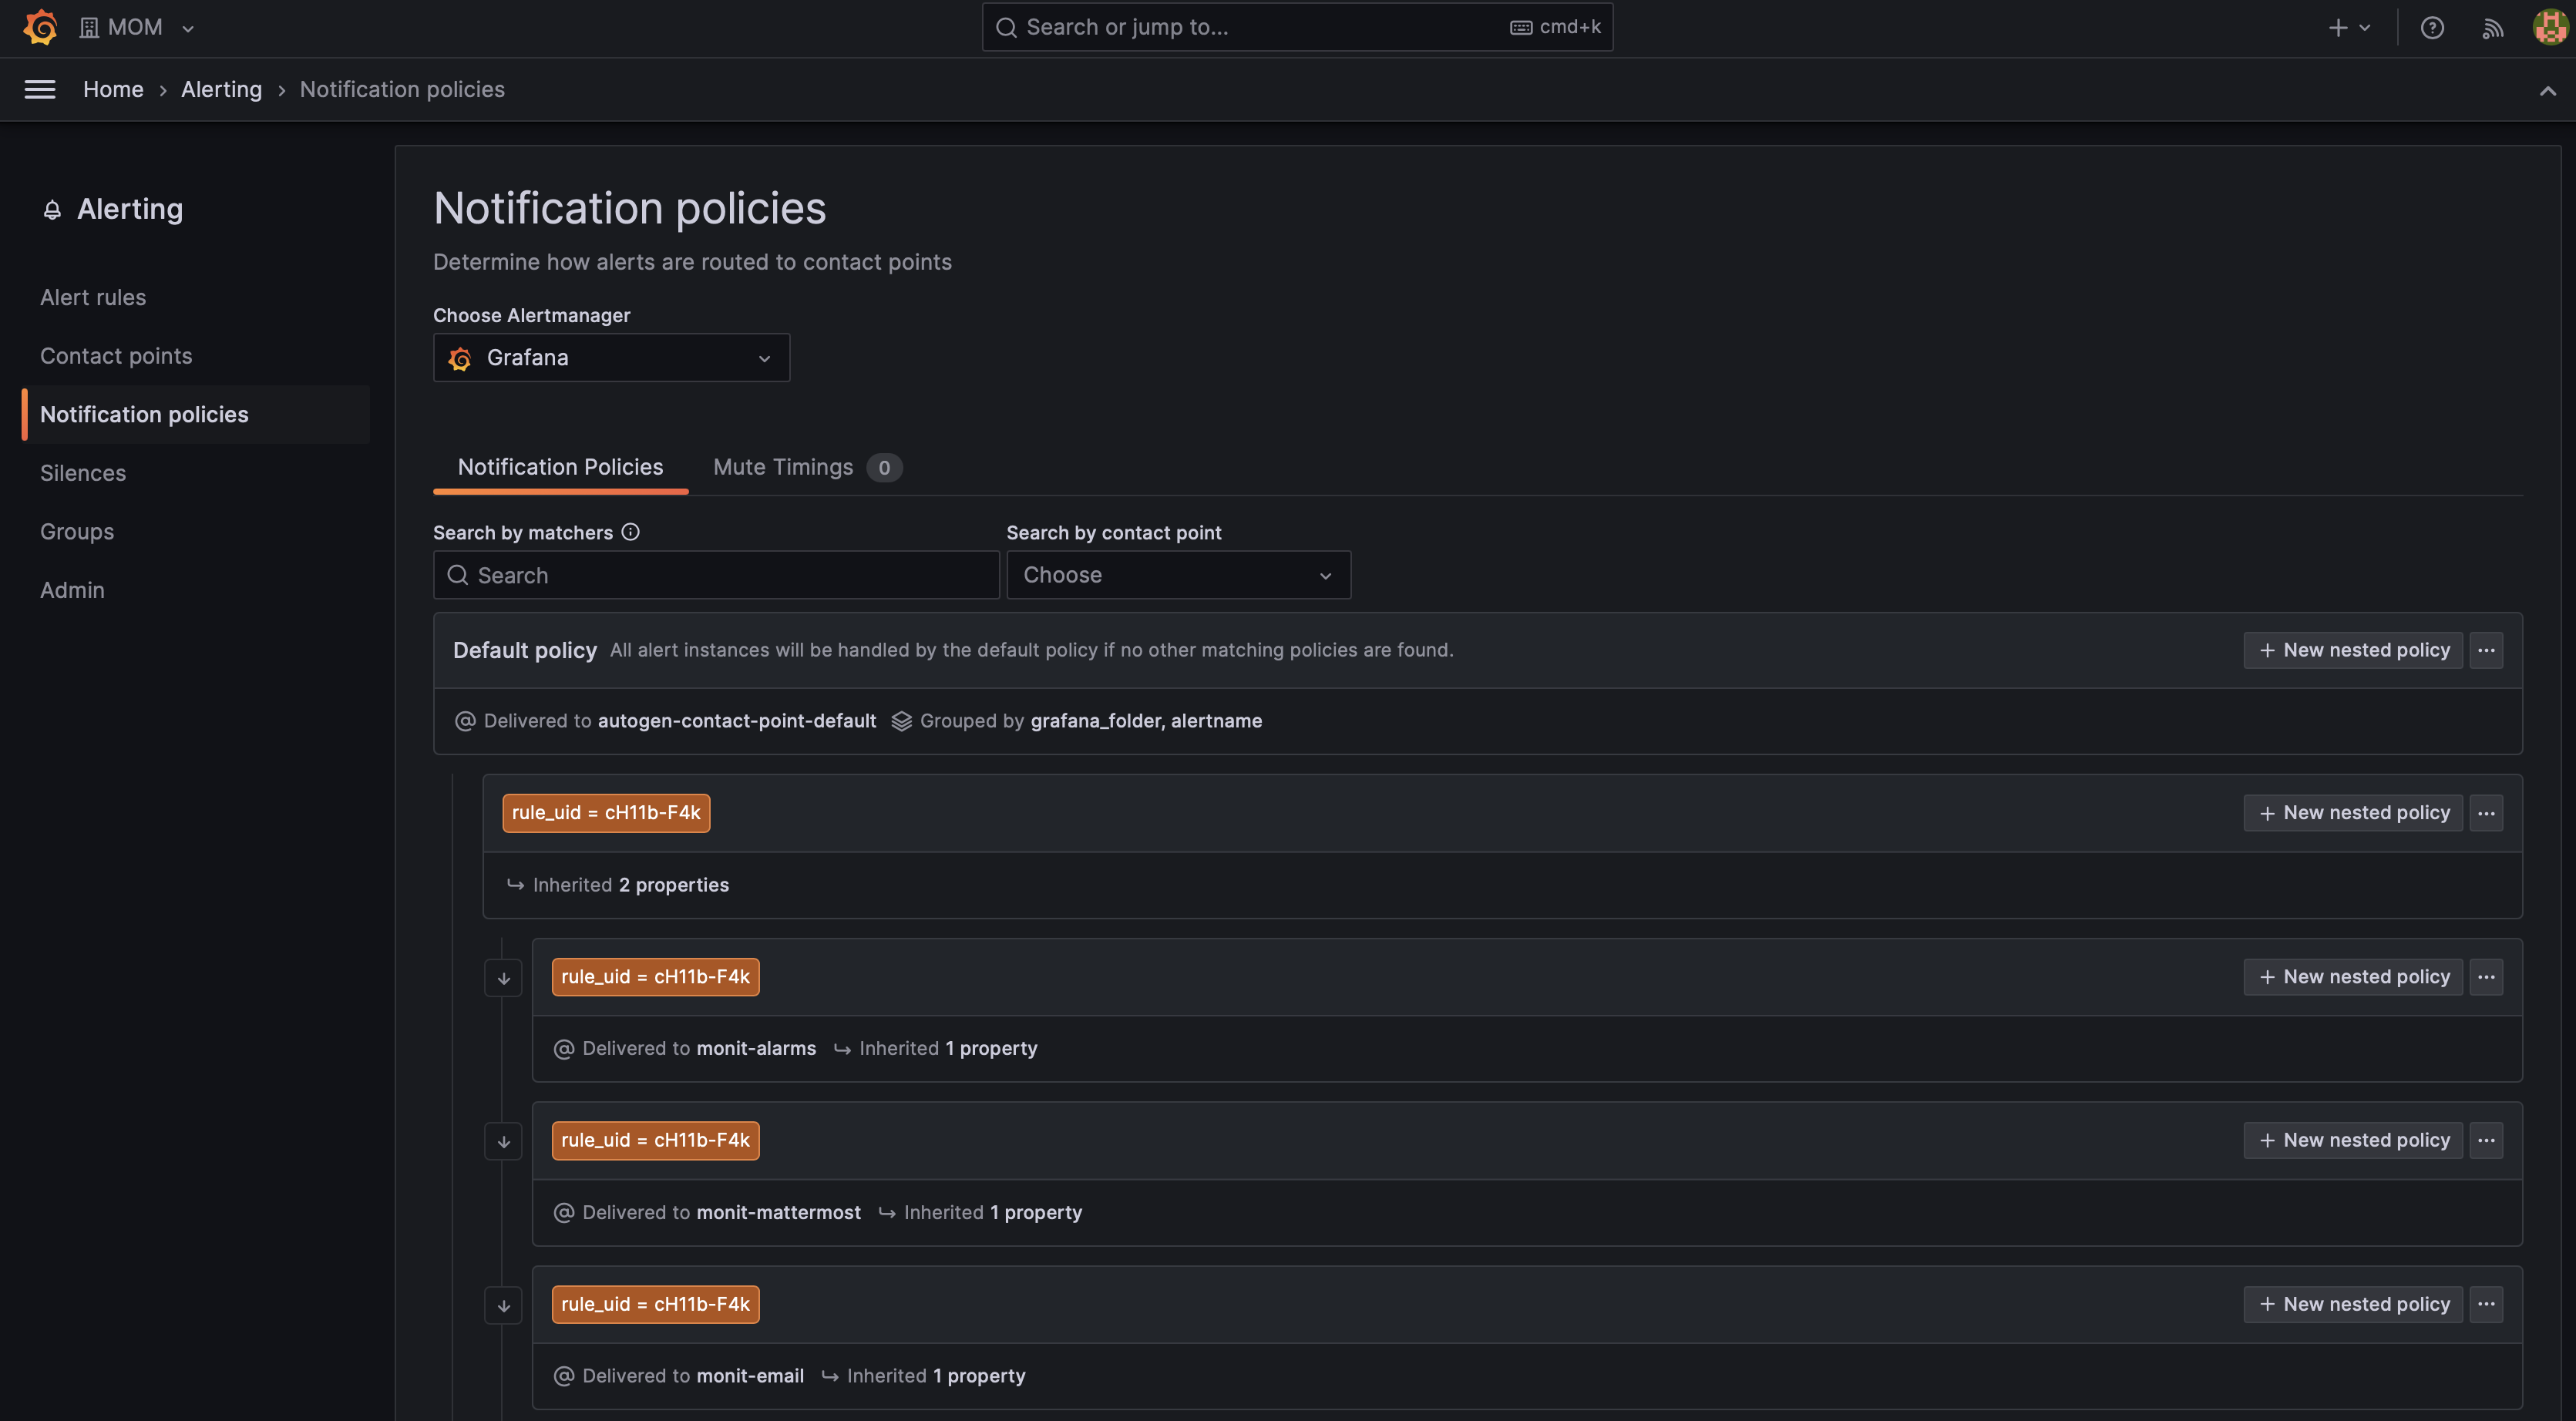
Notification Policies
The notification policies in Grafana are used for creating mapping between alert rules and contact points in order to discover the endpoint the alert notification should be sent to. Alerts are mapped to contact points by matching label values. The policies could be also nested, which allows inheriting definitions from a parent policy.
SNOW integration
The monitoring infrastructure offers full integration with the SNOW REST API in order to generate tickets based on the alerts.
Since in the case of Grafana it's not possible for the monitoring infrastructure to add the correct SNOW information by default, an user interactive way is provided.
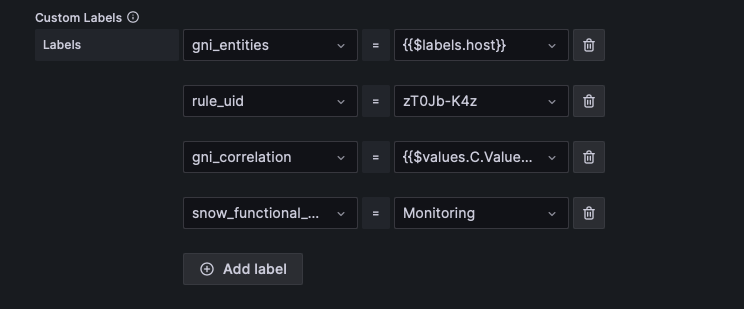
As a service manager, when creating the alarm you will need to specify the SNOW information as well as some extra required labels.
- (mandatory) gni_entities - Defines the name of the entity the alert is triggered for.
- Hint: For multi-instance alerts you can set the label value to existing tag/label from the query: e.g.
{{$labels.host}}
- Hint: For multi-instance alerts you can set the label value to existing tag/label from the query: e.g.
- (optional) gni_alertname - This value is set by default in Grafana to the "Rule name". You can overwrite if different name is required in GNI.
- (mandatory) snow_functional_element - SNOW Functional Element. This field is required for assigning the alarm to the correct FE
- (optional) snow_assignment_level - SNOW assignment level (default: 3)
- (optional) snow_watchlist - Comma separated list of the emails to be added into the watchlist of the ticket.
- (optional) snow_auto_closing - Should the ticket close in case the alert is resolved (default:
false) - (optional) snow_troubleshooting - Troubleshooting information.
Since dynamic labels will create new instances of your alert, for dynamic values like "correlation" you should actually add them as a custom annotation:
- (optional) gni_correlation - The correlation value to be added in the GNI ticket.
- Hint: You can point to a given query/condition value by using
{{$values.A.Vaue}}for setting your annotation, where "A" is the name of the query/condition you defined in the section above.
- Hint: You can point to a given query/condition value by using
- (optional) gni_description - The description added in the GNI ticket.
For backward compatibility the SNOW payload could be configured through annotations (as explained in the "Alert rule annotations" section).
You can either set message or snow annotation containing the fields as per the examples below respectively:
{
  "snow": {
    "functional_element": "Your FE",
    "service_element": "default",
    "assignment_level": 3,
    "troubleshooting": null
  }
}
{
  "functional_element": "Your FE",
  "service_element": "default",
  "assignment_level": 3,
  "troubleshooting": null
}
Please note that among the SNOW fields only functional_element is mandatory and all the others will acquire a value by default.
Have my alerts been migrated correctly?
Once we move to Unified Alerting, existing alerts will be migrated to the new format, this means even if they are still attached to a given plot, the content of the alert as well as the evaluation agent will have changed.
From our checks, alerts are migrated correctly out of the box, but here's a small guide for you to double check it's the case:
Let's take as an example the next alert rule:
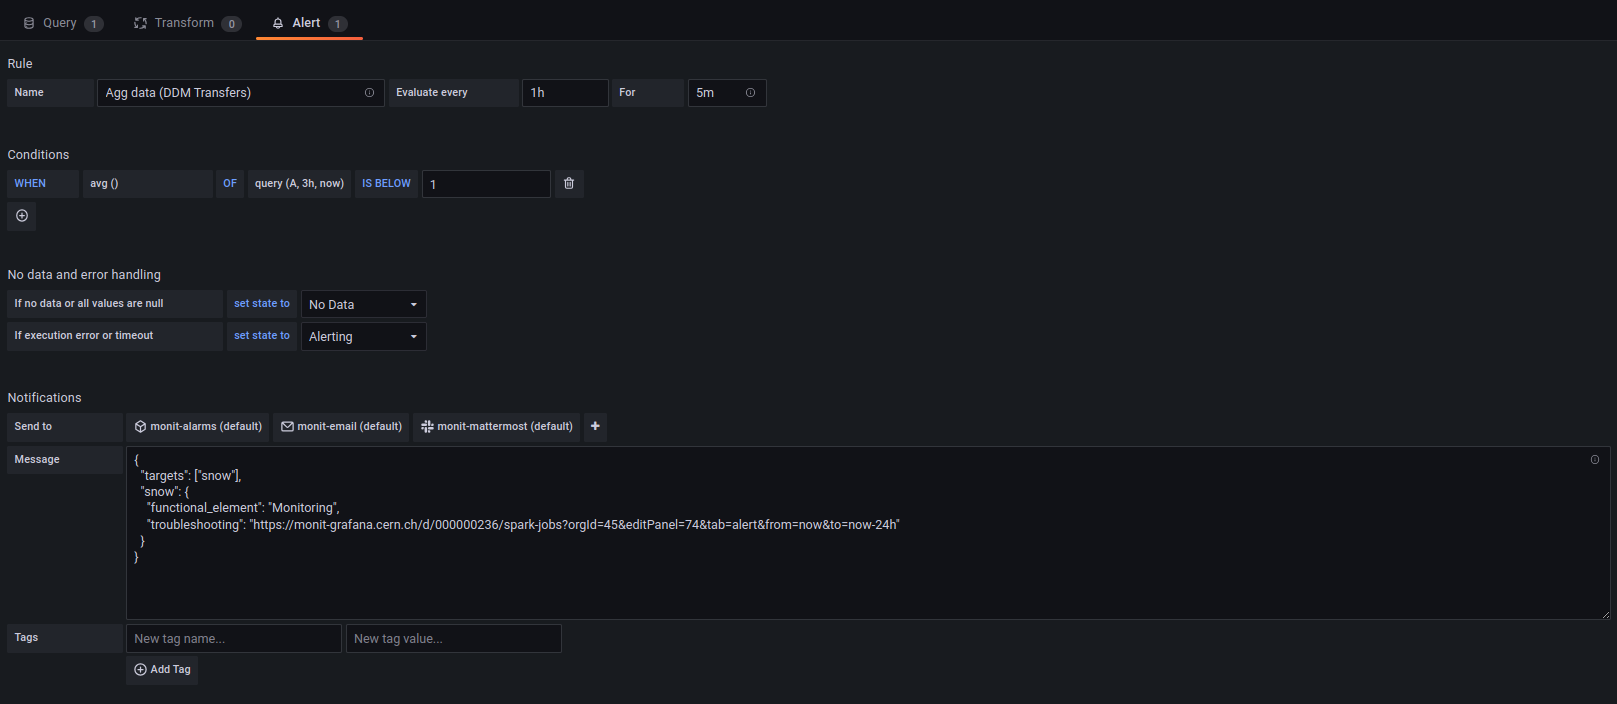
You can see several pieces of information: - Rule: Name, Evaluation interval, Time the alert has to stay in a given condition (For) - Conditions - No data and error handling: State if no data and state if execution error - Notifications: Where to send the alert to, attached message and tags
In the new interface, this information should also be there, but in different places:
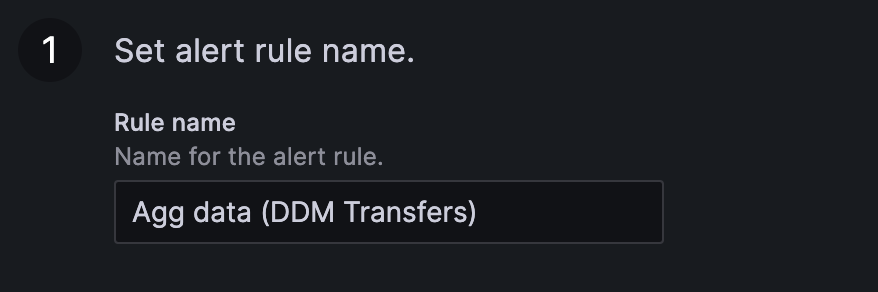
- Rule name, should be the same as the Name in the old alerting
- Query and alert condition: This will include two parts:
- Query: matching the query from the plot with the time interval in the Conditions menu in the old alerting
- Classic conditions: This applies the "WHEN" and the "condition" of the Conditions over the query (i.e: avg() below 1)
- You can also preview you alarm here and check how many of the entities will be firing by pressing in the "Preview" button
IMPORTANT: Old Grafana alerting system was using the resolution of an internal browser to decide the default interval, New system uses the datasource configured "min interval", so if you have alerts that are based on "averages, sums..." make sure your query specified the interval you are interested in, otherwise alarming behaviour might change. Min interval can be set from "options" in the edit query panel or directly as interval in the "group by" statement of your query.
-
Alert evaluation behaviour: Here it's contained the configuration for no data and exectuion error handling
-
Details for your alerts: If you had any message attached, it should be inside this section under "Summary and annotations"
-
Notifications:
- In case you had any contact point outside of the default ones for the organization a new label "contacts" will have been added
- This is the way Grafana migrates by default contact points and links them with the alerts
Testing alerts and contact points
- Alerts can be tested while editing them using the "Preview" button as mentioned in the previous section.
- Alert routing can be also tested while editing an alert by using the "Preview routing" button available in the "Configure notifications" section. This will result in a list of all contact points that will be notified and details about the matching labels to notification policies.
- Contact points can be tested while editing them using the "Test" button, this will create a dummy notification.
Alerting Tips & Tricks
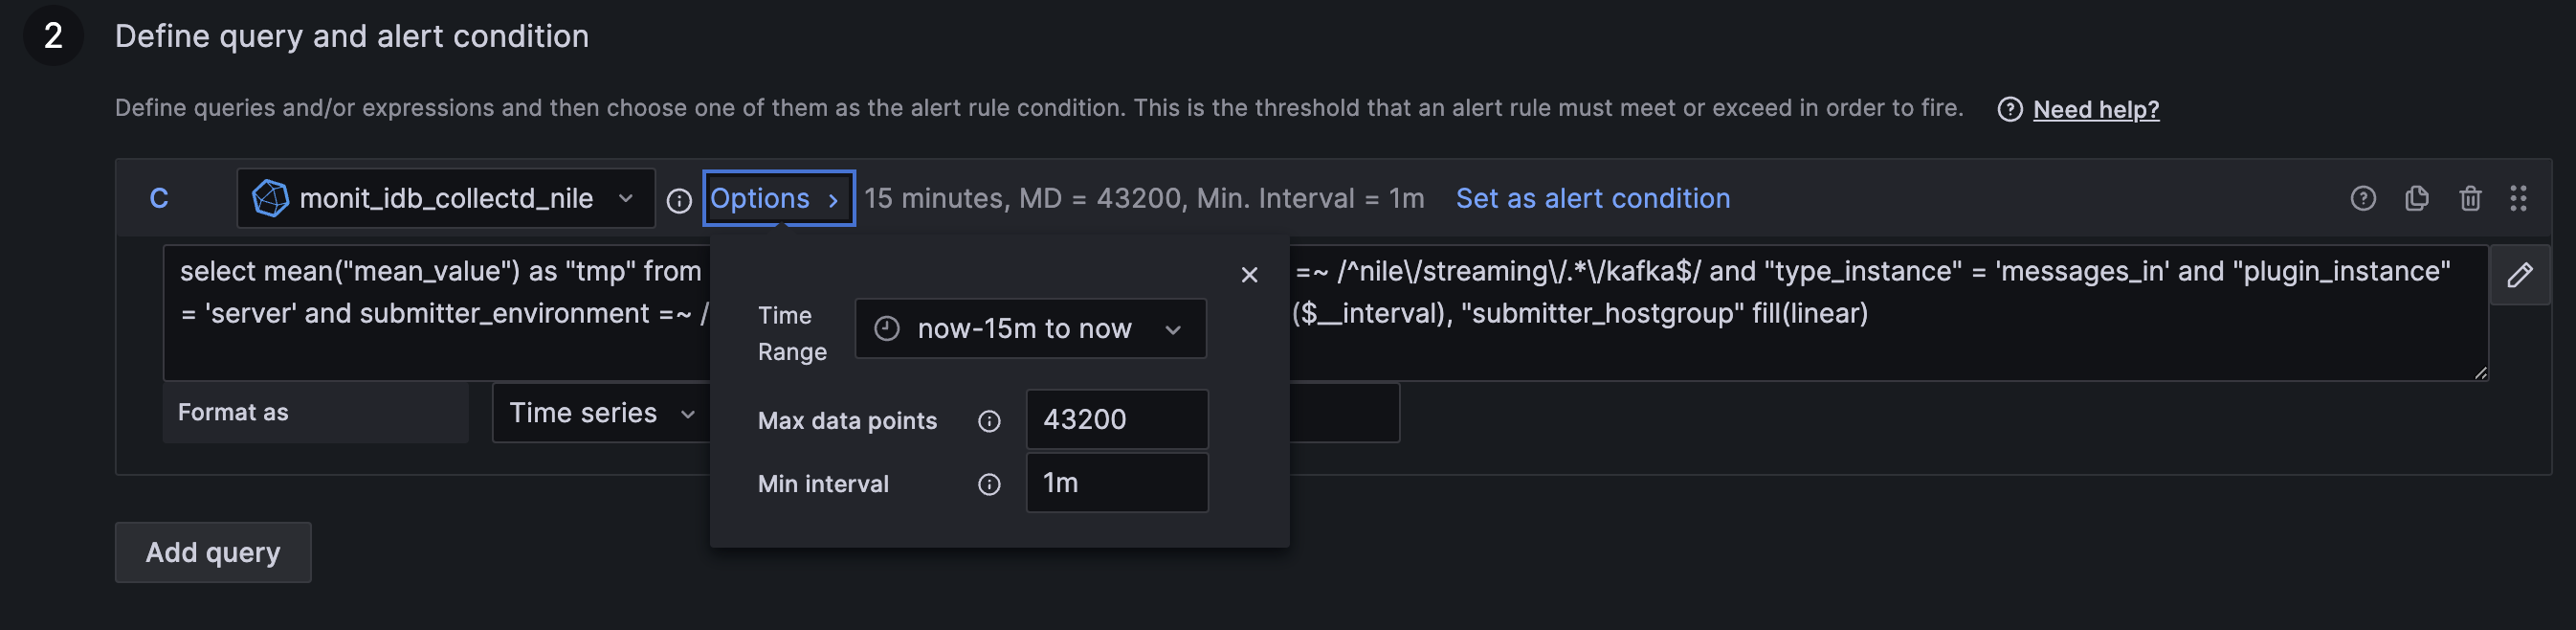
Pay attention to the query "time range"
The Time range option in the Grafana query editor defines the time range for which the data should be fetched during alert evaluation, such as the last hour, ten minutes or a custom time range. The alert rule uses all the fetched data to evaluate the alert condition.
Please make sure to configure the required Time range and Min interval in the query panel options as per the screenshot below. The Min interval is important if you are using the built-in interval variables (e.g. $interval) in time-based aggregation queries.
Make the best use of the Expressions
Grafana offers a set of different expressions for performing calculations, transformations, or aggregations on the data source queried data. It allows the users to create custom metrics or transform existing ones by applying functions for aggregating data over specific time ranges or dimensions and implementing conditional logic to handle different scenarios.
In Grafana Alerting, you can use the Math, Reduce, Resample and Threshold, which are multi-dimensional rules, because they generate a separate alert for each series.
The Classic condition expression is also available, and it creates a single alert when its condition is met, meaning that Grafana sends only a single alert for multiple series. The classic condition is mainly designed to serve for alert migration and backward compatibility with the Legacy Grafana Alerting framework, but it also covers use cases that we will mention later in this section.
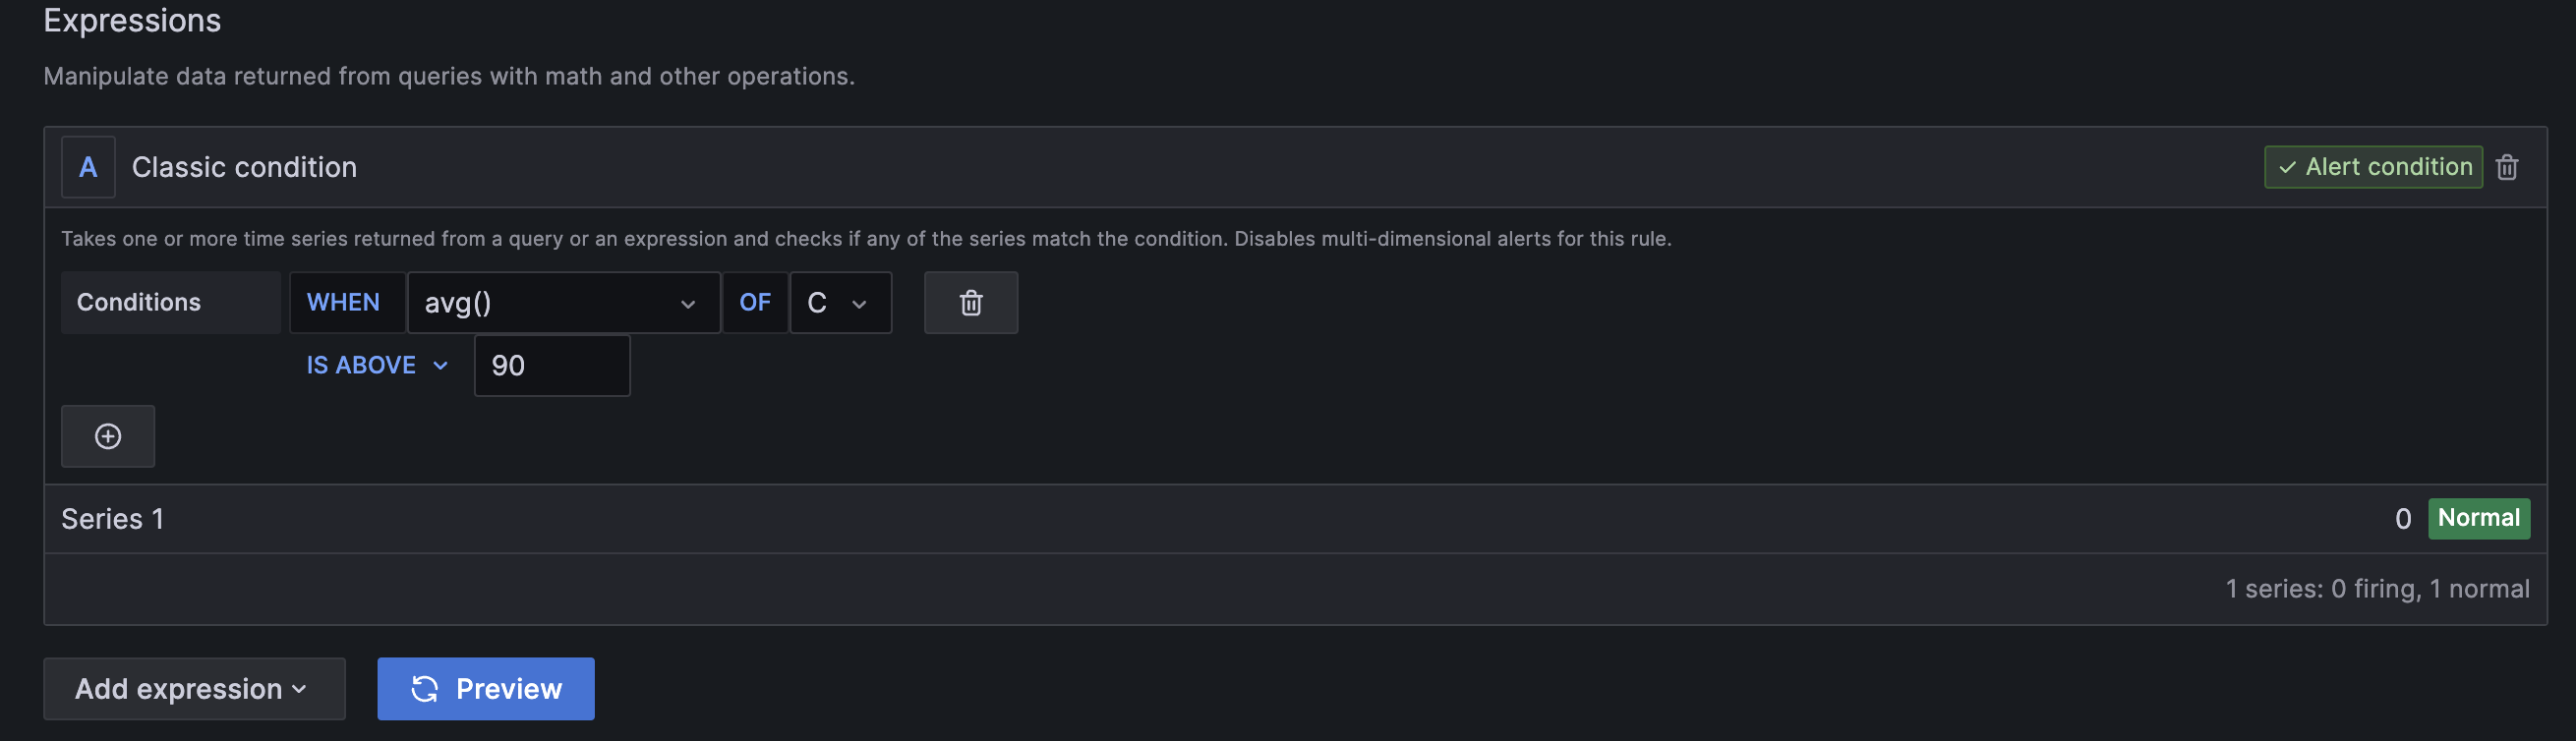
Standard Classic Condition migration to Threshold
For most of the cases, the Classic condition expression could be replaced with a combination of Reduce and Threshold as shown below. The Reduce produces the required aggregation by creating dedicated data instance per set of labels, and the Threshold evaluates each instance separately while exposing the labels in the alert result.
Classic condition example:
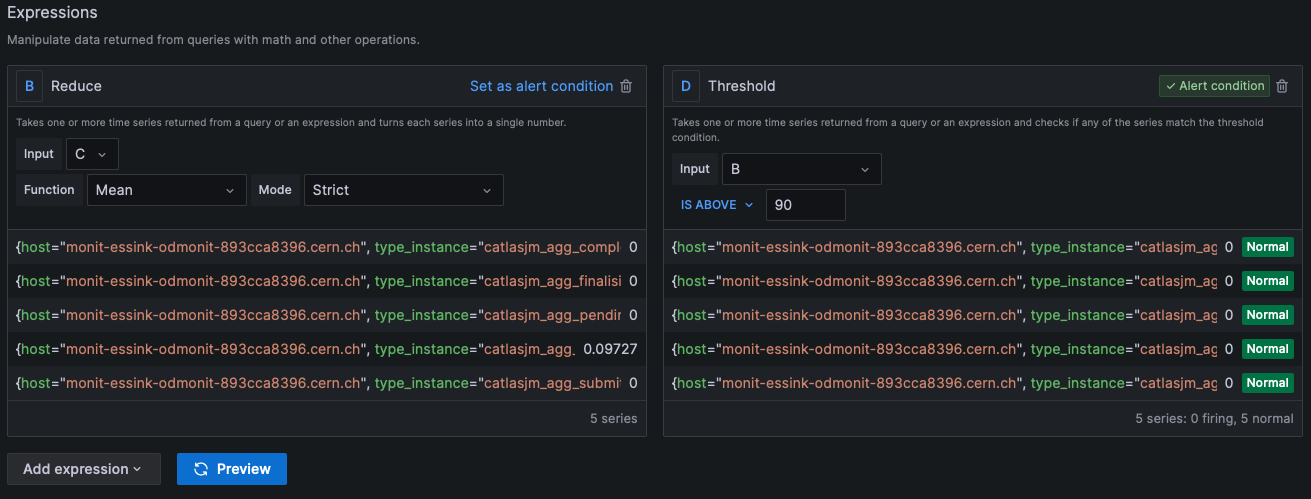
The same alert condition configured using the combination of Reduce and Threshold expressions:
Combining conditions from multiple queries
There could be cases that require having multiple queries in a single alert rule in order to evaluate different data sets against a threshold. In this section, we will cover the approach and limitations using both Math and Classic condition expressions for achieving the required result.
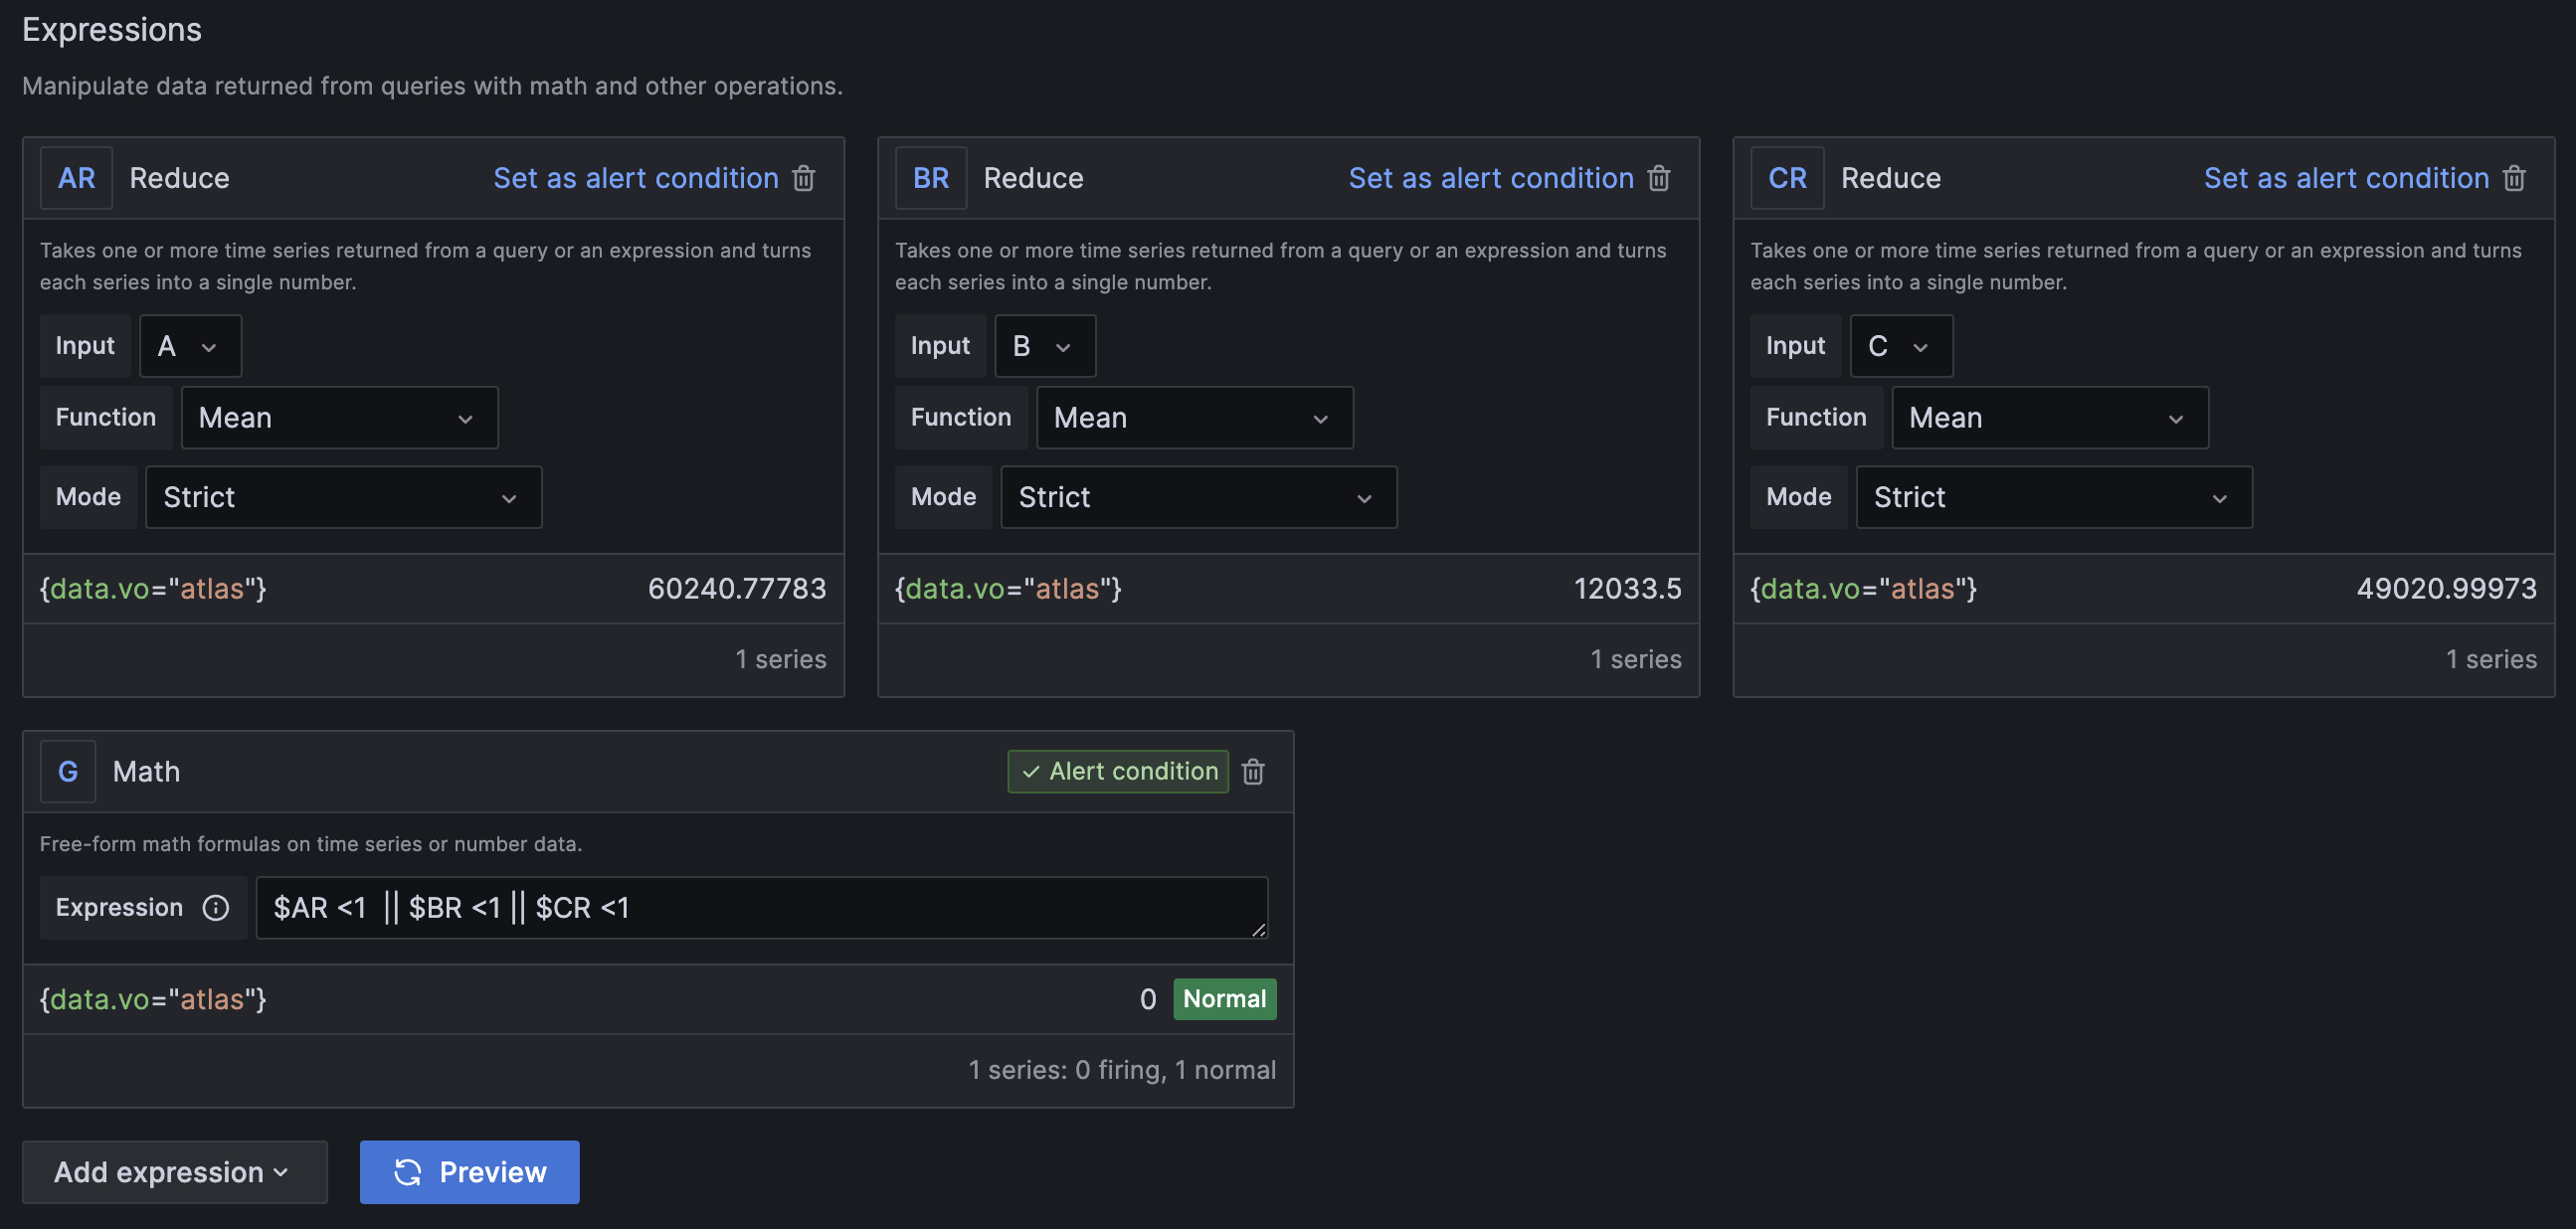
Math Expression
The Threshold expression doesn't support a combination of data from different queries. To achieve this functionality you can use the Math expression, where a combination of different query conditions could be defined manually (e.g. $A > 10 || ($B > 1 && $B <3)). The current limitation of this approach is that all the evaluated datasets in the expression must have common label values, as otherwise the values will not be matched and this will result in NoData.
Classic Condition Expression
Classic Condition supports combining multiple query conditions out-of-the-box as it doesn't rely on labels. In this case, we can easily create the required alert but unfortunately, it might not provide us with the required information of what has failed.
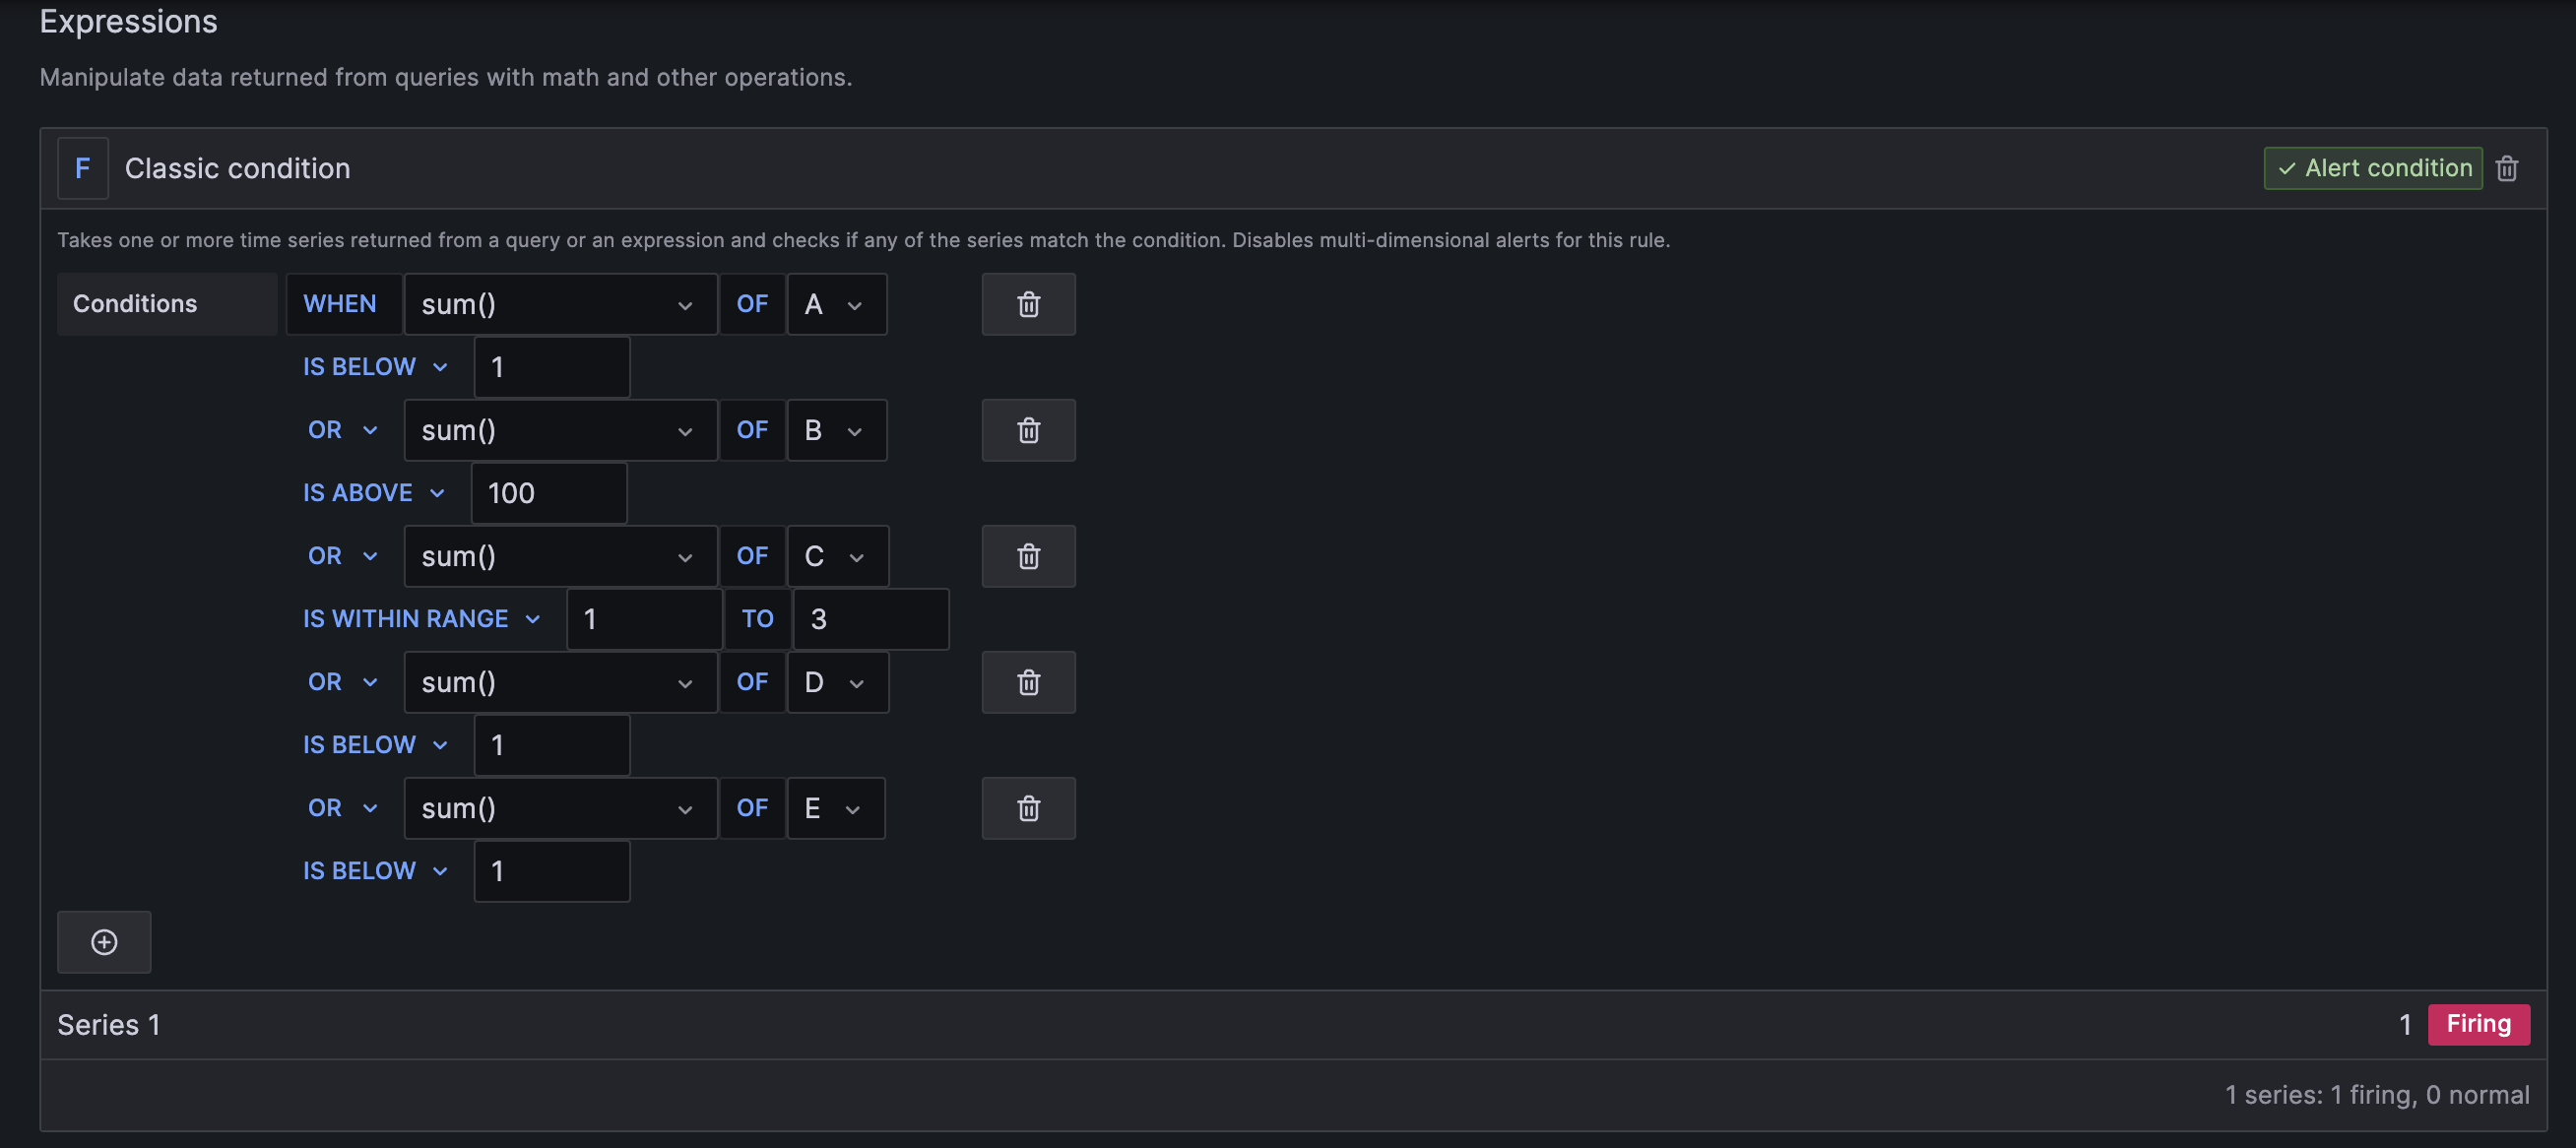
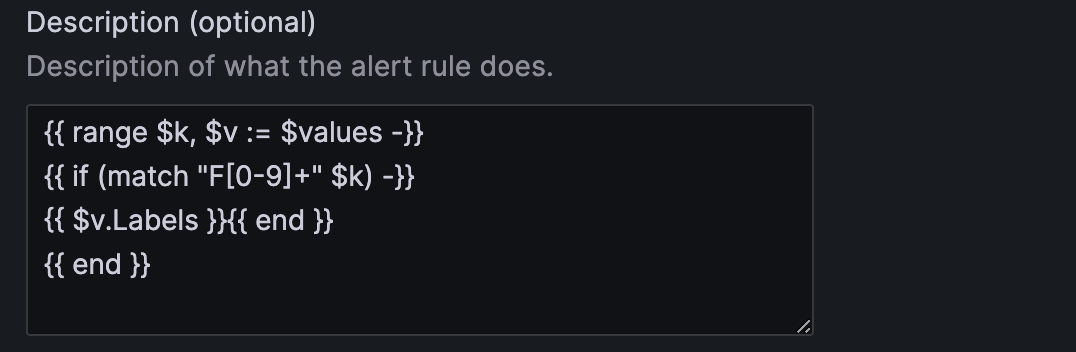
We can do a workaround for the limitations of the default classic condition notification, by adding the query labels into the alert notification using templating functionality as per the Grafana docs.
Using annotations and labels
The functionality of setting labels and annotations for Grafana alerts provides the possibility to enrich the notification with additional information and route the alert to different notification contact points. The annotations and labels are similar types of fields providing useful information but serve slightly different purposes. The annotations are mainly used for providing additional information (e.g. description, troubleshooting, etc.), while the labels should be used to uniquely identify the alert rule and configure alert routing. This of course doesn't exclude the possibility of using labels for adding extra information to the notification.
Templating labels and annotations
Having multi-dimensional alerts is the most powerful feature of the new Grafana Alerting framework and it is all built around the labels, as a unique set of different labels defines an individual alert instance.
This functionality gives you the power and flexibility to gain visibility into your entire system with just a single alert rule.
If you have such kind of rules, then you will notice that all the labels returned by the query will be added into the notification message out of the box. Still you might want to create new labels using regular expressions or combining some label values and you can achieve this through the templating functionality. To achieve this you can access and use the query labels through variables and apply functions on them similarly to the way you can do in Prometheus (e.g. {{ $labels }}, {{ $value }}):
For more details, please refer to the Grafana docs.
Using functions
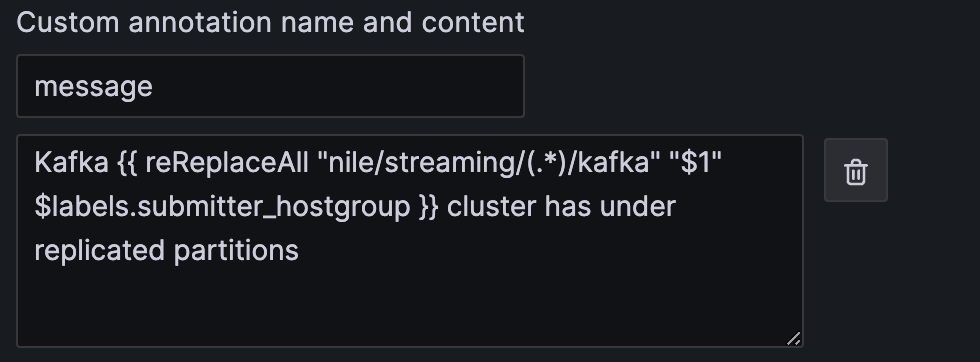
Grafana supports a set of functions that could be used while templating labels and annotations. The full list can be found in the Grafana docs and some of the most useful ones are match, toUpper, toLower, rePlaceAll.
In the following example, we extract a particular name out of the complete submitter_hostgroup field.
Notification policy
Notification policies control when, where and how firing alert notifications are sent. Each notification policy contains a set of label matches to indicate which alert rule or instances it is responsible for. You can configure each notification policy to control how often notifications should be sent as well as having one or more mute timings to inhibit notifications at certain times of the day and certain days of the week. You can also customize notifications with templates and use silences to mute temporary notifications from one or more firing rules.
Group and repeat intervals
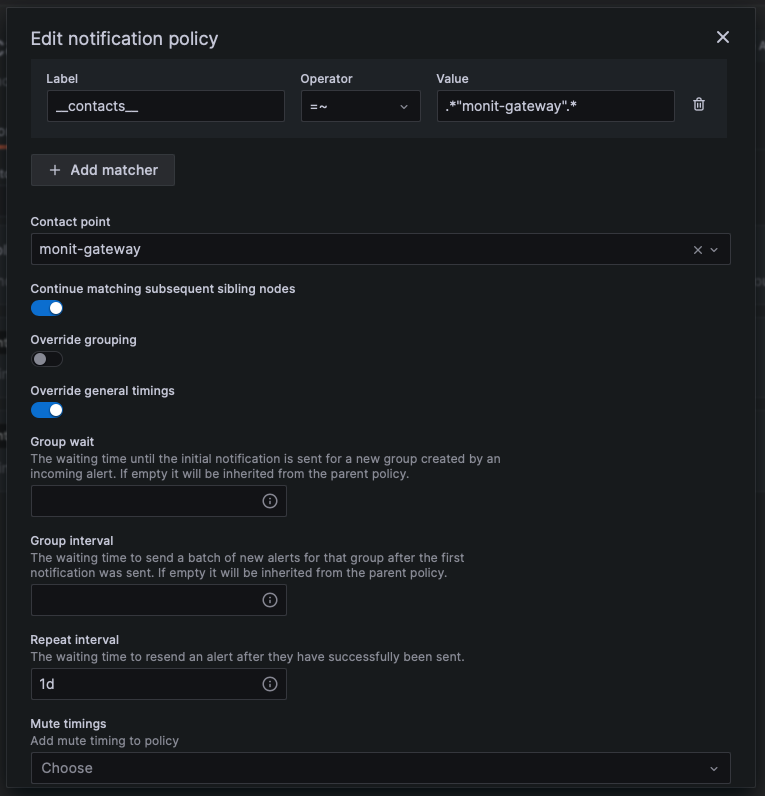
Each notification policy supports the configuration of two important parameters defining the interval the notifications will be sent.
- Group interval: The time waiting to send a batch of alert instances for existing groups (default: 5 minutes). NOTE: Notifications will not be sent any sooner than this interval even if the evaluation or other intervals are configured with lower values.
- Repeat interval: The waiting time to resend an alert after they have successfully been sent. This means notifications for firing alerts will be re-delivered (default: 4 hours).
Silence alert
Silences stop notifications from getting created and last for only a specific time window. It allows you to stop receiving notifications from one or more alert rules. Even a single instance notification from a multi-dimensional alert could be paused based on matching labels criteria. Grafana docs
Mute timings
Mute timing is a recurring interval of time when no new notifications for a policy are generated or sent. They are used to prevent alerts from firing a specific and recurring period (e.g. regular maintenance period) Grafana docs.
Message templates
Grafana notifications are built using notification templates. You can create custom templates and use them for the notifications received via some contact points. For more details, please refer to the Grafana docs.
Grafana Docs
Please refer to the Alerting section on the official Grafana docs page, in case you need any further information regarding the configuration of your alerts.