Service Performance Qualification
Service Performance Qualification metrics in MONIT
The IT Monitoring Service provides infrastructure to store and display information about the different performance metrics of your services over long intervals of time. This infrastructure has been also designed with the idea of reducing the toil for the Service Managers by pulling the required data from various data sources only based on configuration and data queries. All the collected data is stored in a central Influx DB instance and it could be accessed in Grafana.
How to configure SPQ metrics
The workflow is fully driven by configuration files providing the required metrics information. These files are managed by the Service Managers and committed to a GitLab repository. A scheduled MONIT script utilises the configuration data in order to query the Grafana data sources and collect the requested metric values. The repository contains two main folders production and qa, intended to store configuration for the corresponding environments. Within each of the environment folders there are dedicated folders per service that should contain the config.yaml file with the configurations of the metrics. Users can first create configuration in qa in order to test their metric definitions and check if the results look as expected.
When you configure service metrics for the first time, please create the corresponding service folder and the config.yaml file. Users can first create configuration in qa in order to test their metric definitions and check if the results look as expected. It is required that you create a development branch for your changes as direct writes to the master branch are restricted for validation purposes. A sample configuration document looks like this:
metrics:
    <metric name>:
        org_id:
        datasource:
        interval:
        offset_intervals:
        query: |
            <query>
Metric fields:
- <metric name> - the name for the metric;
- org_id - indicates the Grafana ID of the organization that contains the datasource field. It can be obtained in the following way:
- access Grafana in your browser and change to the desired organization;
- check the orgId value in the Grafana URL;

- datasource - indicates the name of the Grafana datasource that's used to run the queries. Currently four types of datasources are supported (InfluxDB, OpenSearch/Elasticsearch, Graphite, Prometheus)
- interval - defines the query time interval. If the interval is set to five minutes, the query will look back for data from five minutes ago until the time of the execution. Supported units are
m- minutes andh- hours.
NOTE: the interval value is not taken into account in case of Influx queries with predefined time windows using the now() function. In case time interval using epoch timestamp values is provided in your query, it will be replaced automatically by the GitLab CI with placeholders. These placeholders are then exchanged by the script to use the interval defined by interval parameter in the configuration.
- offset_intervals - defines the number of offset time intervals the query is shifted back in time. This is very useful in case the data is expected to be available in the datsource after some delay. (e.g. If
interval:5mandoffset_intervals:2the applied time interval of the query will be between15mand10mbefore the time of the execution).
NOTE: the offset_intervals value is not taken into account in case of Influx queries with predefined time windows using the now() function.
-
execution_interval - defines how often the query should be evaluated and the corresponding metric generated. The supported values are:
minute,hour,day,month, and the metric will be generated at the configured interval (e.g. at00:00GMT every day in casedayis configured). DEFAULT:hour -
query - the query that's executed to extract the metric values. We recommend obtaining the query from existing Grafana plots or
ExploreUI following the steps below.NOTE: OpenSearch/Elasticsearch queries are specific and cannot be obtained from the Query Inspector. Please refer to theDatasource Queriessection for more details how to build them:- Access Grafana in your browser and change to the desired organization, and dashboard where the data is.
- For InfluxDB datasources to not have the epoch timestamps, the time must be chosen as "From: now-X" and "To: now"
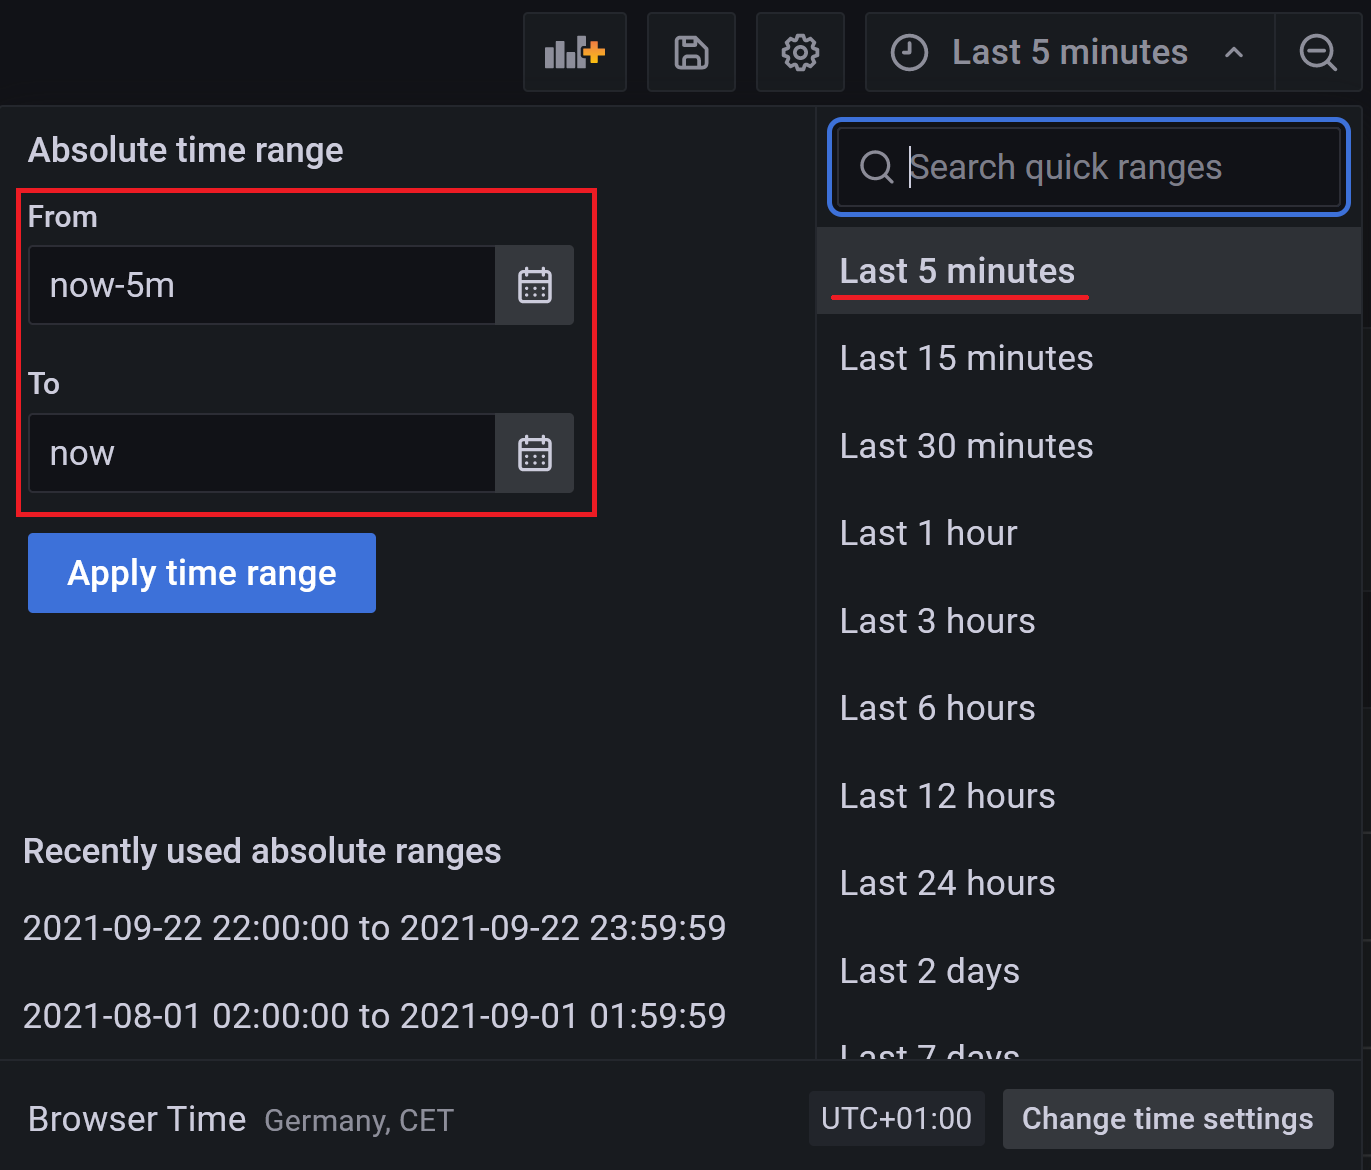
- For the case that a specific date is chosen the query will have epoch timestamps.
- For InfluxDB datasources to not have the epoch timestamps, the time must be chosen as "From: now-X" and "To: now"
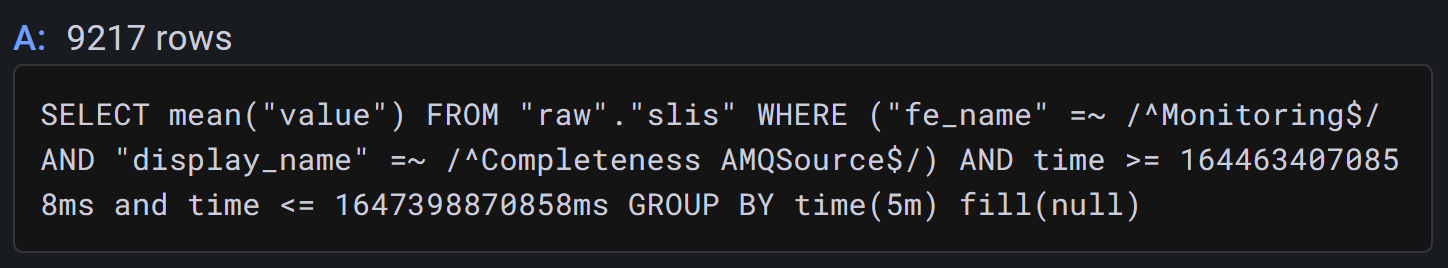
- Go to edit a panel and then press the Query Inspector button.
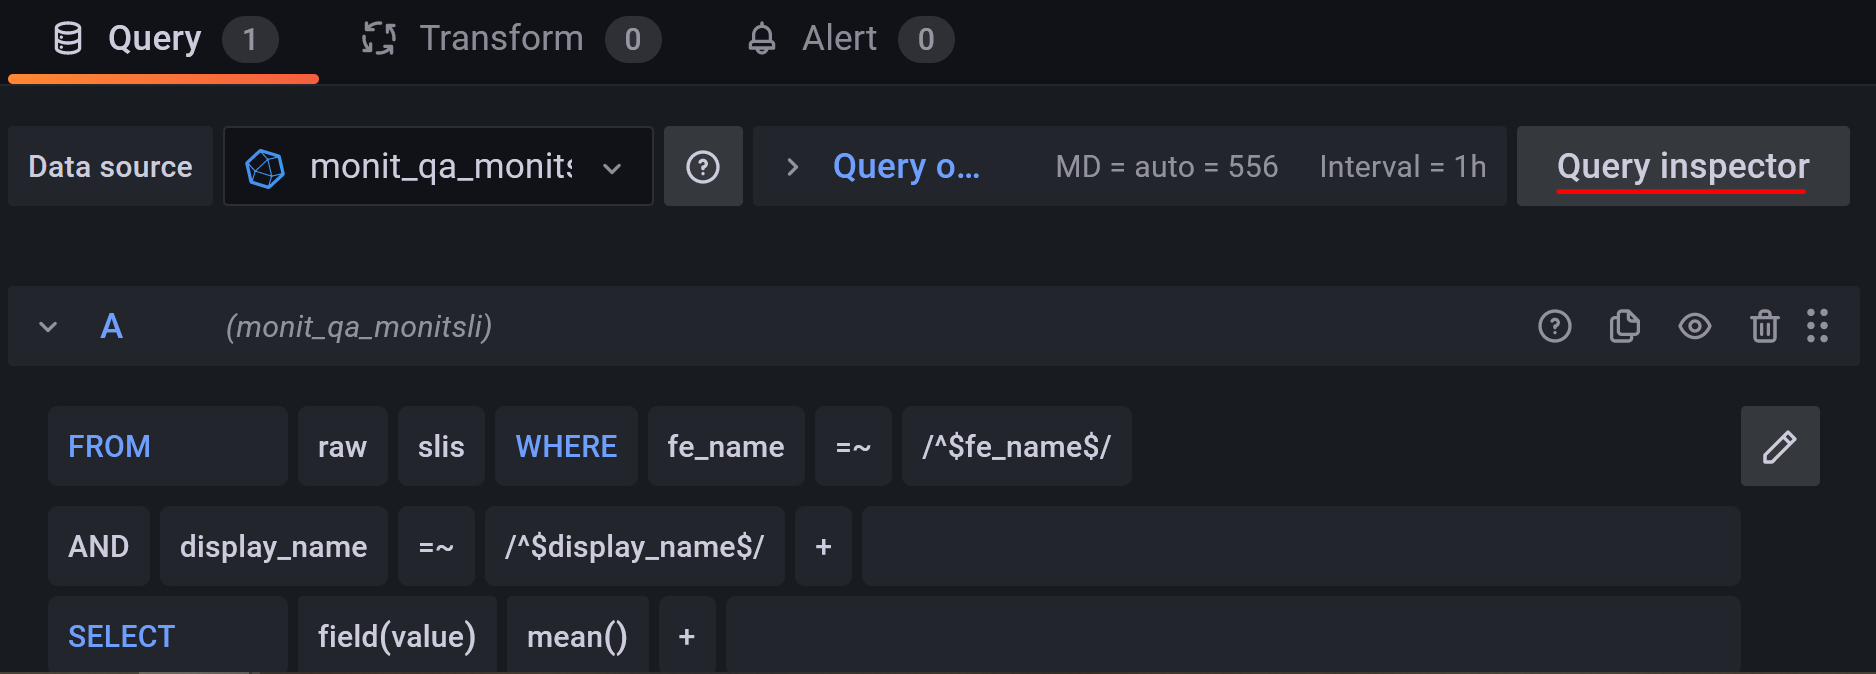
- From the side menu copy the available query and paste it on the config file.
- Access Grafana in your browser and change to the desired organization, and dashboard where the data is.
Datasource Queries
InfluxDB
InfluxDB query is provided in the configuration "as is". Having GROUP BY statement with tags is supported and the result of the query will be stored with the corresponding tag values in the SPQ database.
An example of configuration file for InfluxDB based metrics can be found below:
metrics:
    completeness:
        org_id: 1
        datasource: influx-datasource
        query: SELECT mean("value") FROM "completeness" WHERE ("category" = 'metric') AND time >= now() - 1h and time <= now() GROUP BY time(1m), "name", "resource"
OpenSearch/Elasticsearch
OpenSearch/Elasticsearch queries are configured with key/value map in the query parameter of the configuration. The query map supports the following format and keys:
- query - used to filter the queried documents (e.g. "data.cluster: monit-timber*")
- metrics - defines the resulting metric field and aggregation function that should be applied to it
- type - aggregation function to be applied for calculating the result value
- field - name of the field to be used for obtaining the value
- bucketAggs
- type - type of the field to be used for grouping the result (
termsfor data fields anddate_histogramfor time fields when applying time based aggregation) - field - name of the field to be used for aggregation
- type - type of the field to be used for grouping the result (
An example of configuration file for OpenSearch/Elasticsearch based metrics can be found below:
  log_documents_per_index_pattern:
    datasource: elastic-datasource
    org_id: 1
    interval: 12h
    query:
      query: "data.cluster: monit-timber* AND data.index_pattern: monit_*"
      metrics:
        - type: avg
          field: data.docs_count
      bucketAggs:
        - type: terms
          field: data.index_pattern
        - type: terms
          field: data.cluster
        - type: date_histogram
          field: metadata.timestamp
          settings:
            interval: 6h
Prometheus
PromQL expression is provided under the query parameter of the configuration "as is". Grouping by label is supported and the result of the query will be stored with the corresponding grouping label values in the SPQ database. Configuring interval is required for Prometheus queries.
An example of configuration file for Prometheus based metrics can be found below:
metrics:
  prometheus_test:
    datasource: prometheus-datasource
    org_id: 1
    interval: 5m
    query: avg by (hostgroup) (collectd_flume_flume_channel_channel_fill_percentage{hostgroup=~\"monitoring/flume/amqsource\",environment=~\"production\",type=~\".*.*.*\"})
Graphite
Graphite "target" is provided under the query parameter of the configuration "as is". Grouping by label is supported and the result of the query will be stored with the corresponding grouping label values in the SPQ database. Configuring interval is required for Graphite queries.
An example of configuration file for Graphite based metrics can be found below:
metrics:
   afs_local_latency:
    datasource: graphite-datasource
    org_id: 1
    interval: 5m
    offset_intervals: 1
    query: maxSeries(movingAverage(groupByNode(afs.accesstimes.*.*.*.latency_s, 2, 'max'), '2min'))
Postgres
SQL query is provided under the query parameter of the configuration "as is". Please make sure to specify the "time" field.
  num_instances_single:
    datasource: dbod02
    org_id: 1
    interval: 1h
    query: select CURRENT_TIMESTAMP as time, count(*) from apiato.instance where status='ACTIVE' and category!='REF' and cluster_id is NULL
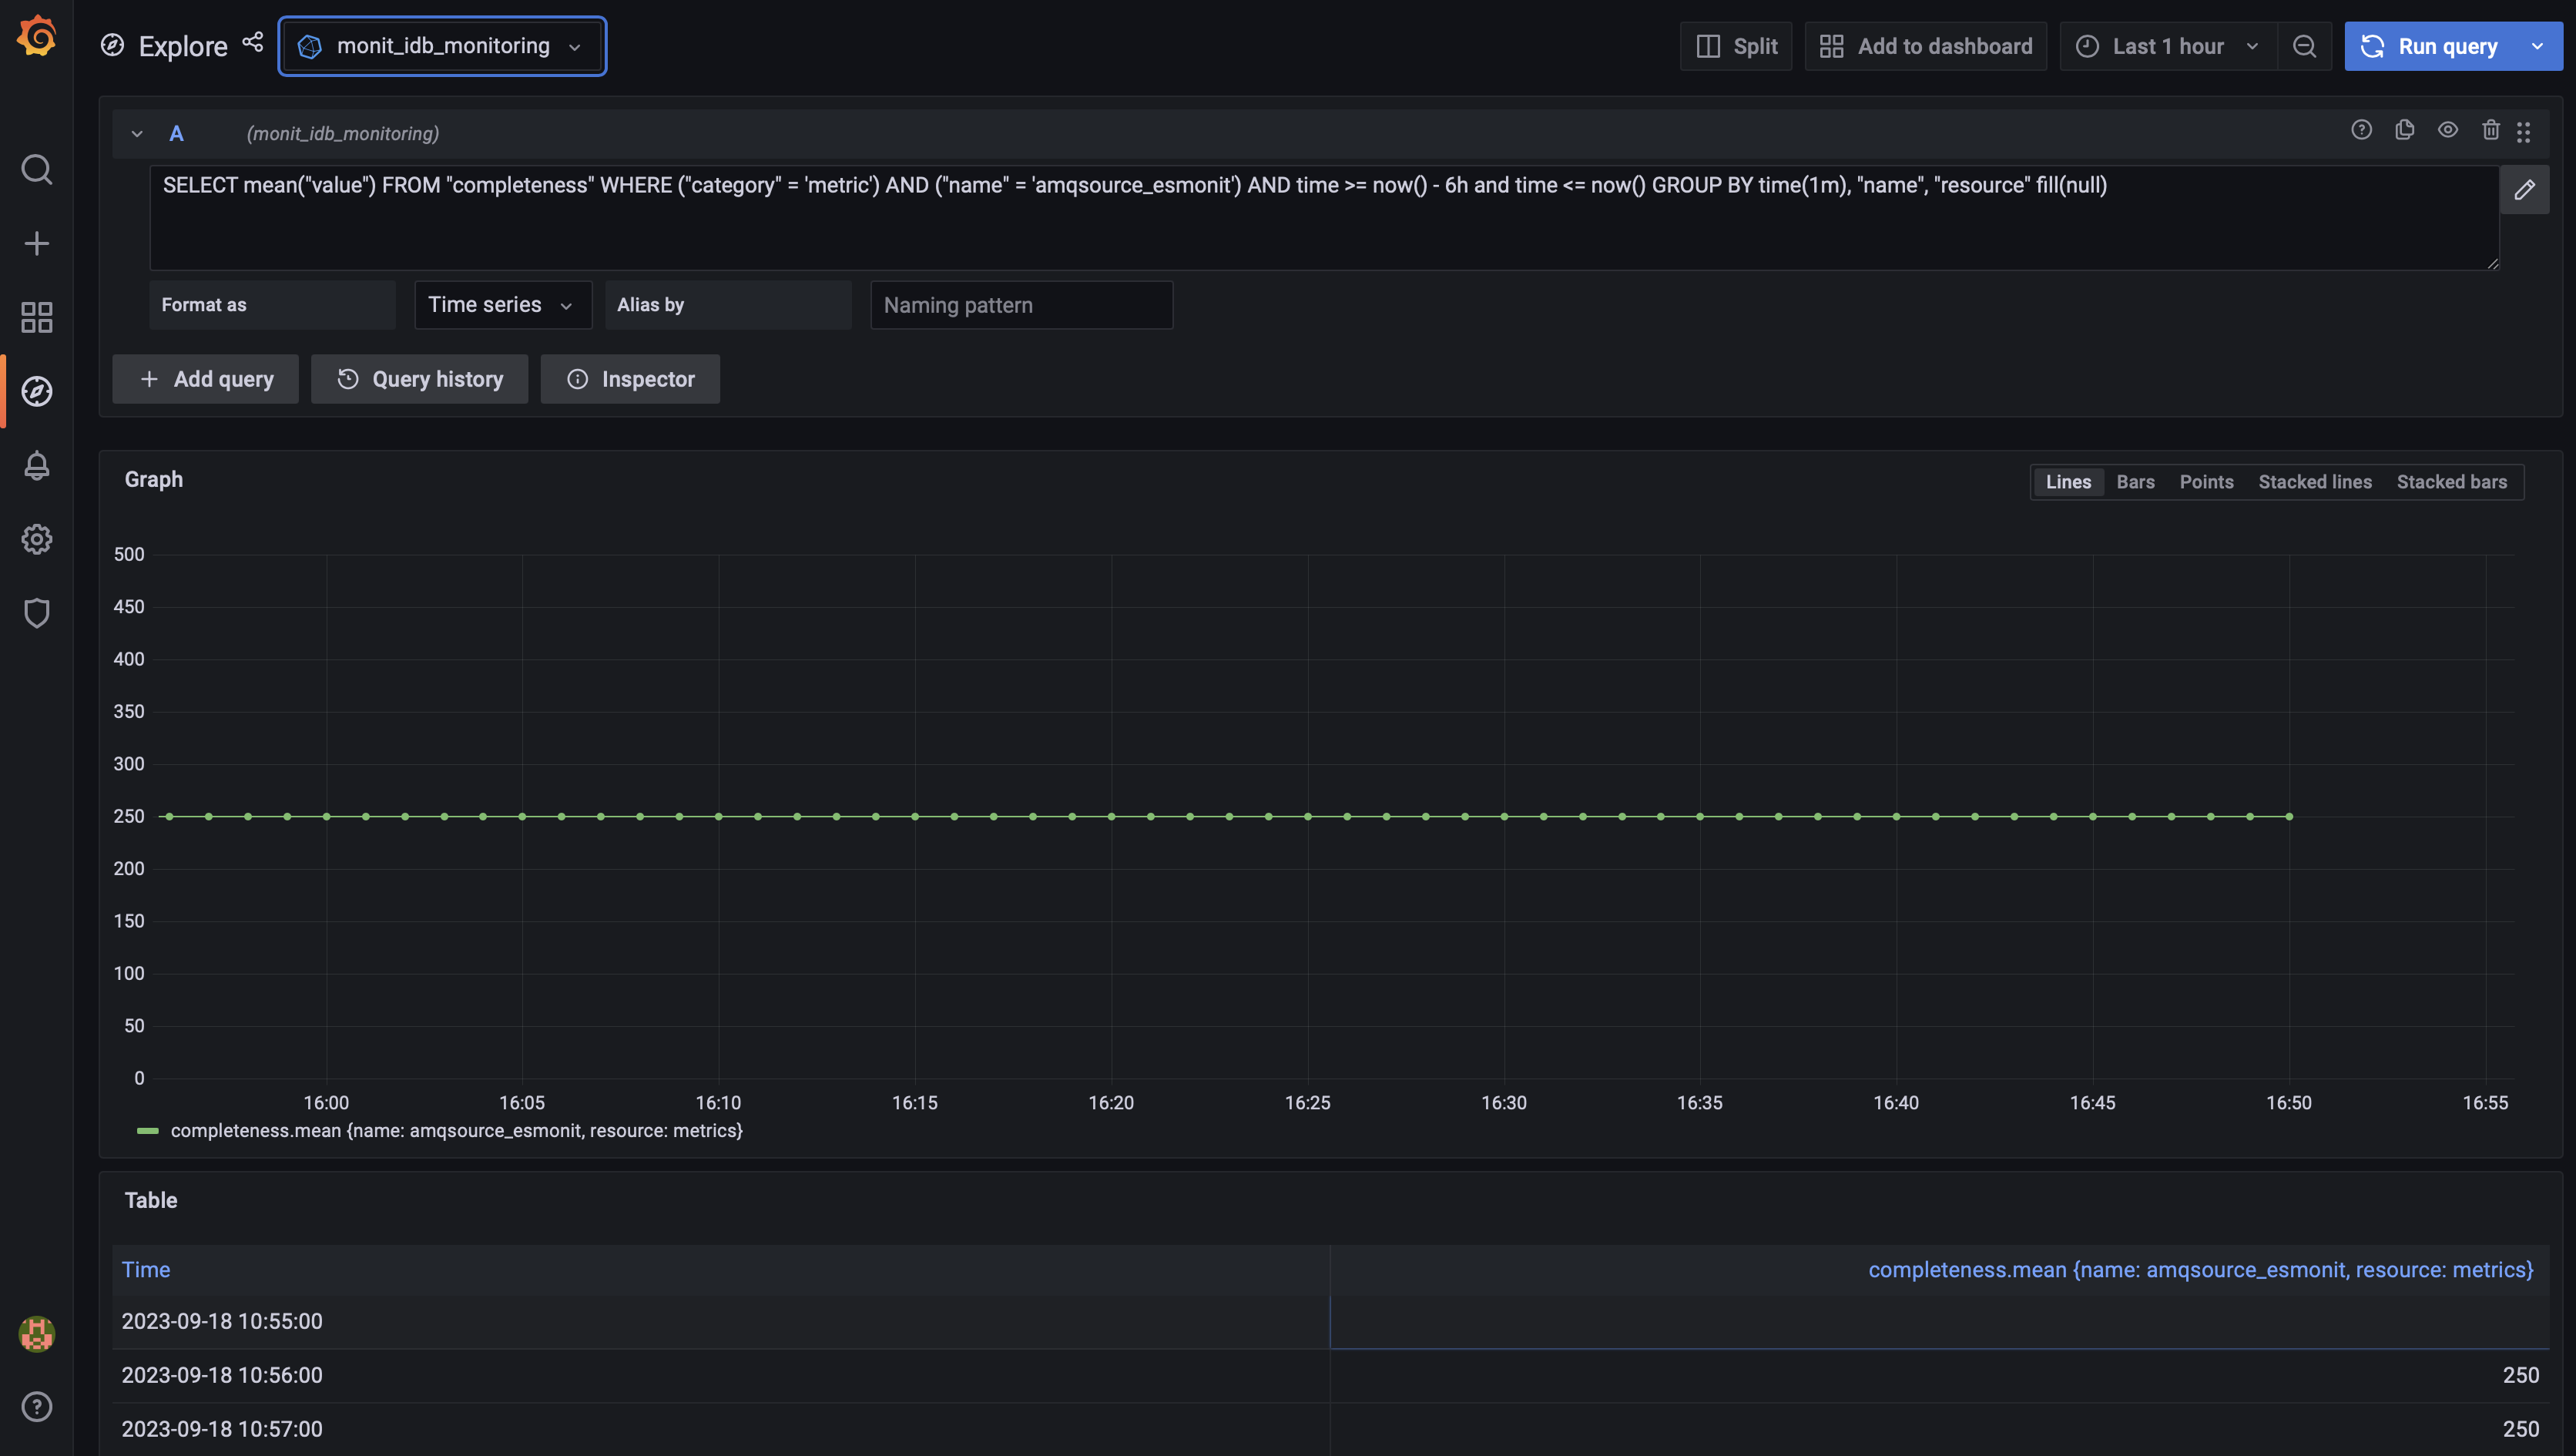
Testing your query in Grafana
One can easily test the query using the Explore feature in the corresponding Grafana organization.
This is recommended in order to guarantie that the submitted query in the configuration will be correct.
MONIT also provides "discovery" dashboard in Grafana for validation purposes, where the metrics can be checked once the configuration is merged into the master branch: Service Performance Metrics (Discovery)
Access Service Performance Metrics in Grafana
Accessing Service Performance Metrics in Grafana requires having configured data source in your organization. Please contact the IT Monitoring Service requesting the Grafana datasource: SNOW
Once having access to the SPQ datasource, you can find your metrics in a measurement named after your service (service name matches the config folder name in the GitLab repository). All the metrics are stored in a single measurement and can be filtered out by using the metric_name tag value.
For validation purposes the users can use the following dashboard in Grafana: Service Performance Metrics (Discovery)