Using Collectd
This section explains how to use Collectd for service monitoring.
Official Plugins
Collectd comes with many official plugins:
- aggregation
- amqp
- amqp1
- apache
- battery
- bind
- ceph
- cgroups
- chain
- connectivity
- conntrack
- contextswitch
- cpu
- cpufreq
- csv
- cuda
- curl
- curl_json
- dbi
- dcpmm
- df
- disk
- dns
- dpdk_telemetry
- entropy
- ethstat
- exec
- fhcount
- filecount
- filter
- fscache
- genericjmx
- hddtemp
- hugepages
- intel_pmu
- intel_rdt
- interface
- ipc
- ipmi
- iptables
- irq
- iscdhcp
- java
- load
- logfile
- lvm
- mcelog
- memcached
- memory
- mongodb
- mysql
- netlink
- network
- nfs
- nginx
- ntpd
- numa
- nut
- openldap
- openvpn
- oracle
- ovs_events
- ovs_stats
- pcie_errors
- perl
- ping
- postgresql
- powerdns
- processes
- procevent
- protocols
- python
- rabbitmq
- redis
- rrdcached
- rrdtool
- sensors
- smart
- snmp
- snmp_agent
- statsd
- swap
- sysevent
- syslog
- table
- tail
- tail_csv
- target_v5upgrade
- tcpconns
- thermal
- threshold
- turbostat
- unixsock
- uptime
- users
- uuid
- varnish
- virt
- vmem
- write_graphite
- write_http
- write_kafka
- write_log
- write_network
- write_prometheus
- write_riemann
- write_sensu
- write_tsdb
- zfs_arc
- zookeeper
To start using any of these plugins:
- make sure that the plugin is already not include as a base plugin. NOTE: processes is a base plugin but by default only general statistics are collected: the number of processes in each state and fork rate. For specific process configuration whitelisting of the hostgroup is required in MONIT.
- check if the plugin is already whitelisted, if not please open a SNOW ticket.
- check if your hostgroup is already whitelisted (must be included in some 'selector'), if not please open a SNOW ticket.
- declare the plugin in your hostgroup, for example:
class { '::collectd::plugin::apache':
    instances => {
        'apache80' => {
            'url' => 'http://localhost/server-status?auto',
        },
    },
}
Community Plugins
In addition to the official plugins, many other community plugins are also avaialble:
- actuator
- apachelog
- appserver_certificates
- blockdevice_drivers
- bonding
- cadvisor
- certificate
- compute
- cvmfs
- elasticsearch
- elasticsearch_functional
- elasticsearch_kibana_functional
- elasticsearch_ownhome_functional
- eos
- filter
- flume
- haproxy
- heartbeat
- kafka
- kafka_consumer_group
- kafka_topic
- kafka_topics
- lb_status
- mdstat
- megaraidsas
- monit_alarm_handler
- nfsiostat
- processcount
- puppet
- sasarray
- sendmail
- session
- simplerabbitmq
- slurm
- smart_tests
- systemd
- tail
- tapequeue
- unmounted_filesystems
- vmstats
To start using any of these plugins:
- check if the plugin is already whitelisted, if not please open a SNOW ticket.
- check if your hostgroup is already whitelisted (must be included in some 'selector'), if not please open a SNOW ticket.
- declare the plugin in your hostgroup, for example:
class { '::cerncollectd_contrib::plugin::flume' :
    config => [{
        'agent' => $agent_name
    }],
}
If you wish to add another plugin write the deployment and configuration of the plugin following the release process below.
Native Plugins
Before starting, let's first introduce the main collectd terminology:
- Plugin: the name of the module producing the data, you can think of it as a sensor (e.g. disk)
- Plugin instance (optional): the subentity for which the sensor is reporting about (e.g. vda)
- Type: the type of the values as represented in types.db
- Type instance (optional): a further division of the values in categories (e.g. free, used)
- Interval: the sampling period for your plugin
If you wish to write your own collectd plugin:
- first thing, make sure a similar plugin doesn't exist :) either official or in the community
- if not, write the plugins using the official collectd documentation for Python, Java, or Perl.
- write the deployment and configuration of the plugin following the release process below
- for testing, use the local command line tool
collectdctl(usage details below) - ask us to whitelist your plugin, open a SNOW ticket indicating the hostgroup you plan to use
- provide some numbers on the disparity of the "plugin instance", "type", and "type instance" values
- finally, if all the checks were ok we will proceed to whitelist the new plugin in our "production" flow
Important: As a general rule, we advise users to develop the Plugin in a way that the different number of plugin instances, types and type instances is as small as possible. This is related with a limitation faced in InfluxDB regarding the storage. Taking that into account the developer should decide whether to go for a simple Collectd type or something more complex like a types aggregation. In some extreme cases it will be in our hand to reject the plugin from being whitelisted if we foresee that it will create problems in the infrastructure.
Release Process
To add a new or existing plugin to monitor your service, please check this workflow:
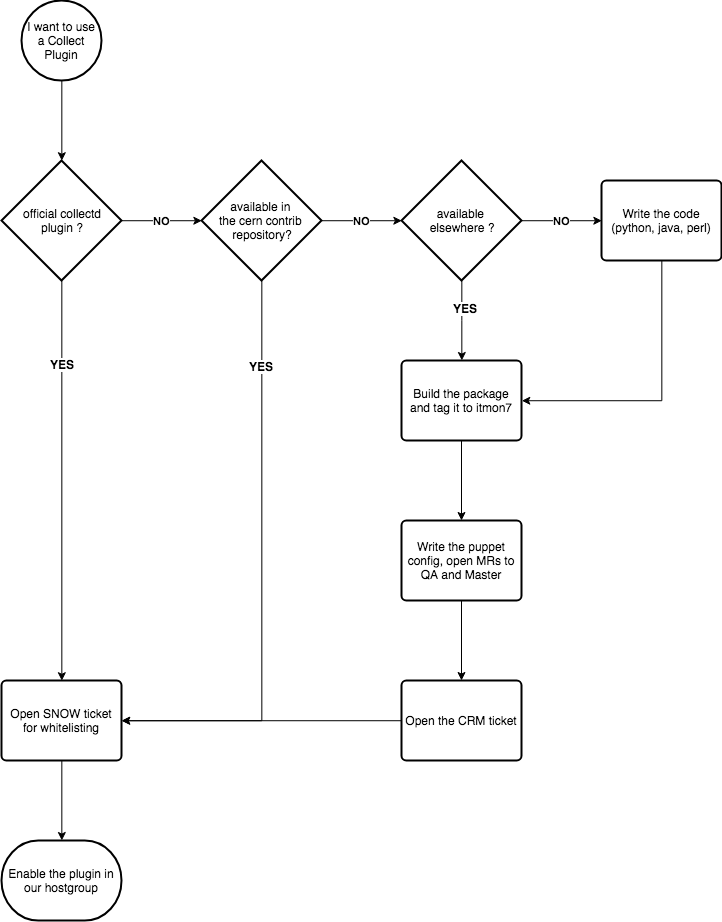
To add a new plugin in cerncollectd_contrib please follow these steps:
- complete the implementation of the puppet module for your plugin (please branch from QA).
- if you are updating an existing plugin, open a CRM ticket and add "monit-support" in the watch list.
- open one Merge Request for your module into QA
- tag it with the CRM number "[CRM-XXXX] Descriptive message" or "[NOCRM] Descriptive message"
- select "Squash commits" and "Remove source branch" in both cases.
- make sure the plugin package is available in Koji/Yum under Collectd7/Collectd8.
- the MONIT team will take care of reviewing the MR and move the changes to QA and Master
- will ping you in the CRM in case there is one, otherwise the change will be moved to master straightforward
- once the MR is in production you can close the CRM ticket.
Local Metrics
Service managers can use this option to exclude metrics from being sent to the MONIT infrastructure. These metrics can still be used to raise alarms in the infrastructure.
This functionality can be defined via different methods, one being Hiera. The following example excludes the DF plugin from being sent to the collectd writers.
---
cerncollectd_contrib::plugin::filter::local:
  'df':
    'match_options':
      'Plugin': '^df$'
This mechanism is based on the Collectd chains plugin. Some documentation regarding this functionality can be found at the following locations: * https://collectd.org/wiki/index.php/Chains * https://collectd.org/wiki/index.php/Match:RegEx
Data Access
Grafana
Since the data is stored in InfluxDB it can be easily visualised with Grafana, the only thing you will need to do depending on which organisation you are working will be add the datasource or ask for it to be added.
Adding the datasource
In order to add a datasource to Grafana you need to have admin rights on the organisation or ask someone that is. The procedure is easy, just press in the Grafana logo in the top left corner and then click in "datasources", finally "add datasource".

Exploring your data
In Grafana, when you click for autodiscovery a query is sent to IDB, if you feel this query is taking too long or getting stuck, please check the "Time filtering show tag queries" (only part of the MONIT grafana deployment) in the datasource configuration and set it to a sensitive value "1h" or "3h" for example.
Collectdctl
Collectdctl is the command line tool used to access your Collectd metrics locally, it comes installed by default as part of the Collectd deployment and already configured so you can use it right away.
As part of the CERN deployment of Collectd we have added some arguments to the tools that aren't yet in sync with the upstream version, so here is the documentation for them.
- collectdctl listval state=[UNKNOWN|OKAY|WARNING|FAILURE]: Will output the list of metrics on a given state.
- collectdctl flushstate
: Puts the state of a metric back to the initial "UNKNOWN" state. - collectdctl evalstate
: Forces the threshold plugin to regenerate the state of a metric based on the last value sampled by Collectd.